C/1903 M1 Borrelly
more info
Comet C/1903 M1 was discovered on 21 June 1903 by Alphonse L.N. Borrelly (Marseille Observatory, France). The prediscovery images were found on plates exposed on 29-30 May (Harvard College Observatory). At the moment of discovery, C/1903 M1 was about two months before perihelion passage, and it was last seen on 23 October 1903. [Kronk, Cometography: Volume 3].
In July-August, C/1903 M1 was a naked eye object with maximum brightness between 2 and 3. Before its conjunction with the Sun comet was extensively observed up to August 24. After perihelion passage it was observed a few times in October at the Royal Observatory from the Cape of Good Hope (South Africa).
This comet made its closest approach to the Earth on 16 July 1903 (0.267 au), that is 3.5 weeks after its discovery.
Solution given here is based on data spanning over 0.332 yr in a range of heliocentric distances from 1.52 au through perihelion (0.330 au) to 1.36 au.
This Oort spike comet suffers moderate planetary perturbations during its passage through the planetary system that lead to escape the comet from the planetary zone on a hyperbolic orbit (see future barycentric orbit)
More details in Królikowska et al. 2014.
| solution description | ||
|---|---|---|
| number of observations | 653 | |
| data interval | 1903 06 29 – 1903 10 23 | |
| data type | perihelion within the observation arc (FULL) | |
| data arc selection | entire data set (STD) | |
| range of heliocentric distances | 1.52 au – 0.33 au (perihelion) – 1.36 au | |
| detectability of NG effects in the comet's motion | NG effects not determinable | |
| type of model of motion | GR - gravitational orbit | |
| data weighting | YES | |
| number of residuals | 653 | |
| RMS [arcseconds] | 2.03 | |
| orbit quality class | 2a | |
| orbital elements (heliocentric ecliptic J2000) | ||
|---|---|---|
| Epoch | 1903 09 03 | |
| perihelion date | 1903 08 28.10837683 | ± 0.00005757 |
| perihelion distance [au] | 0.33018087 | ± 0.00000150 |
| eccentricity | 1.00040917 | ± 0.00000310 |
| argument of perihelion [°] | 127.251980 | ± 0.000260 |
| ascending node [°] | 294.909653 | ± 0.000054 |
| inclination [°] | 85.015231 | ± 0.000197 |
| reciprocal semi-major axis [10-6 au-1] | -1,239.23 | ± 9.40 |
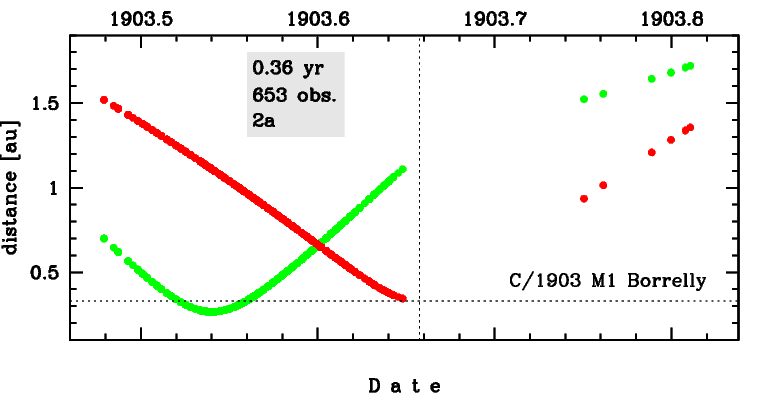
Time distribution of positional observations with corresponding heliocentric (red curve) and geocentric (green curve) distance at which they were taken. The horizontal dotted line shows the perihelion distance for a given comet whereas vertical dotted line — the moment of perihelion passage.