C/1987 W3 Jensen-Shoemaker
more info
Comet C/1987 W3 was discovered by Carolyn S. and Eugene M. Shoemaker (with the 0.46-m Schmidt telescope at Palomar) on 24 November 1987 (IAUC 4503), when the comet was about two months before its perihelion passage. It was next announced (IAUC 4505) that the same comet was discovered by Poul Jensen on an earlier exposure taken by Karl Augustesen on 25 October (with the 0.45-m Schmidt telescope at the Copenhagen Observatory's Brorfelde station). Later, two more pre-discovery observations from September were found. The comet was last seen on 29 April 1990.
C/1987 W3 made its closest approach to the Earth on 17 October 1987 (2.47 au), that was three months before its perihelion passage.
Solution given here is based on data spanning over 2.60 yr in a range of heliocentric distances: 3.51 au – 3.33 au (perihelion) – 7.77 au.
This Oort spike comet suffers moderate planetary perturbations during its passage through the planetary system that lead to escape of the comet from the solar system (see future barycentric orbit).
See also Królikowska 2014 and Królikowska and Dybczyński 2017.
| solution description | ||
|---|---|---|
| number of observations | 34 | |
| data interval | 1987 09 24 – 1990 04 29 | |
| data type | perihelion within the observation arc (FULL) | |
| data arc selection | entire data set (STD) | |
| range of heliocentric distances | 3.51 au – 3.33 au (perihelion) – 7.77 au | |
| detectability of NG effects in the comet's motion | NG effects not determinable | |
| type of model of motion | GR - gravitational orbit | |
| data weighting | NO | |
| number of residuals | 65 | |
| RMS [arcseconds] | 1.22 | |
| orbit quality class | 1a | |
| orbital elements (heliocentric ecliptic J2000) | ||
|---|---|---|
| Epoch | 1987 12 31 | |
| perihelion date | 1988 01 18.80890900 | ± 0.00268000 |
| perihelion distance [au] | 3.33281436 | ± 0.00001639 |
| eccentricity | 1.00477970 | ± 0.00002465 |
| argument of perihelion [°] | 194.736359 | ± 0.000546 |
| ascending node [°] | 198.345564 | ± 0.000086 |
| inclination [°] | 76.715895 | ± 0.000095 |
| reciprocal semi-major axis [10-6 au-1] | -1,434.13 | ± 7.38 |
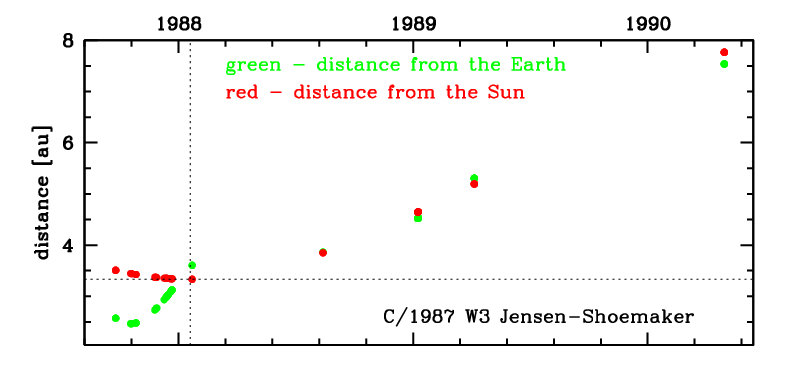
Time distribution of positional observations with corresponding heliocentric (red curve) and geocentric (green curve) distance at which they were taken. The horizontal dotted line shows the perihelion distance for a given comet whereas vertical dotted line — the moment of perihelion passage.