C/1993 K1 Shoemaker-Levy
more info
Few first positions of comet C/1993 K1 were measured by Brian A. Skiff and Carolyn S. Shoemaker from exposures taken by C. S. Shoemaker, Eugene M. Shoemaker and David H. Levy on 23 May 1993 (with the 0.46-m Schmidt telescope at Palomar; see IAUC 5808). At that moment the comet was more than eight months before its perihelion. Pre-discovery observations from 18 March were found much later by M. Meyer.
The comet made its closest approach to the Earth on 6 May 1993 (4.35 au), that was 2.5 weeks before discovery. Similar close approach to the Earth was in the next opposition when the comet was within 4.48 au from the Earth (on 12 May 1994, about 3.5 months after perihelion passage).
Solution given here is based on data spanning over 2.9 yr in a range of heliocentric distances: 5.24 au – 4.85 au (perihelion) – 7.27 au.
This Oort spike comet suffers rather strong planetary perturbations during its passage through the planetary system that lead to notable more tight future orbit with semimajor axis shorter than 2000 au (see future barycentric orbit).
See also Królikowska 2014 and Królikowska and Dybczyński 2017.
| solution description | ||
|---|---|---|
| number of observations | 44 | |
| data interval | 1993 05 23 – 1996 01 27 | |
| data type | perihelion within the observation arc (FULL) | |
| data arc selection | entire data set (STD) | |
| range of heliocentric distances | 5.24 au – 4.85 au (perihelion) – 7.27 au | |
| detectability of NG effects in the comet's motion | NG effects not determinable | |
| type of model of motion | GR - gravitational orbit | |
| data weighting | NO | |
| number of residuals | 86 | |
| RMS [arcseconds] | 1.02 | |
| orbit quality class | 1a | |
| orbital elements (heliocentric ecliptic J2000) | ||
|---|---|---|
| Epoch | 1994 02 17 | |
| perihelion date | 1994 02 01.94776000 | ± 0.00391000 |
| perihelion distance [au] | 4.84927746 | ± 0.00002489 |
| eccentricity | 1.00023279 | ± 0.00003717 |
| argument of perihelion [°] | 232.445275 | ± 0.000466 |
| ascending node [°] | 30.328581 | ± 0.000102 |
| inclination [°] | 67.766928 | ± 0.00007 |
| reciprocal semi-major axis [10-6 au-1] | -48.01 | ± 7.66 |
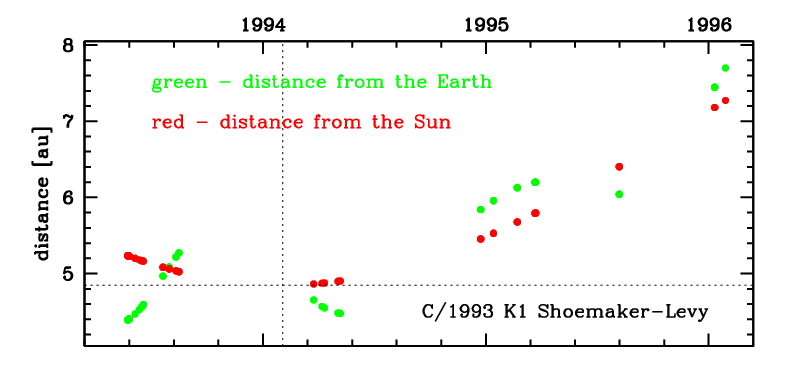
Time distribution of positional observations with corresponding heliocentric (red curve) and geocentric (green curve) distance at which they were taken. The horizontal dotted line shows the perihelion distance for a given comet whereas vertical dotted line — the moment of perihelion passage.