C/2006 S3 LONEOS
more info
Comet C/2006 S3 was discovered on 19 November 2006 by LONEOS at heliocentric dostance of 14.3 au as an object with cometary apperance and soon a few prediscovery observations taken by Catalina Sky Survey on 17 September 2006 were found [IAUC 8752, 2006 September 21]. Later, more prediscovery observations were reported (taken on 29 August 2006 and 13 October 1999). Comet passed perihelion in mid-April 2012 and since its discovery was observed during many consecutive oppositions (see figure). In August 2023, data arc extends up to 24 January 2020 and are available at MPC.
Solutions given here are based on data covered 26.1 yr in a range of heliocentric distances: 26.1 au – 5.131 au (perihelion) – 19.8 au.
Comet had its closest approach to the Earth on 1 June 2012 (4.141 au, 1.5 months after perihelion).
NG orbits are determinable, however some trends in residuals with time are still visible.
This Oort spike comet suffers slight planetary perturbations during its passage through the planetary system; however, they lead to escape of the comet from the solar system on hiperbolic orbit (see future barycentric orbit).
See also Królikowska and Dones 2023 and Królikowska and Dybczyński 2017.
| solution description | ||
|---|---|---|
| number of observations | 6480 | |
| data interval | 1999 10 13 – 2016 05 05 | |
| data type | perihelion within the observation arc (FULL) | |
| data arc selection | entire data set (STD) | |
| range of heliocentric distances | 26.14 au – 5.13 au (perihelion) – 11.38 au | |
| type of model of motion | NC - non-gravitational orbits for symmetric CO-g(r)-like function | |
| data weighting | YES | |
| number of residuals | 10589 | |
| RMS [arcseconds] | 0.50 | |
| orbit quality class | 1a+ | |
| orbital elements (heliocentric ecliptic J2000) | ||
|---|---|---|
| Epoch | 2012 04 23 | |
| perihelion date | 2012 04 16.32003390 | ± 0.00016883 |
| perihelion distance [au] | 5.13111870 | ± 0.00000135 |
| eccentricity | 1.00349158 | ± 0.00000159 |
| argument of perihelion [°] | 140.128874 | ± 0.000023 |
| ascending node [°] | 38.370826 | ± 0.000009 |
| inclination [°] | 166.032639 | ± 0.000003 |
| reciprocal semi-major axis [10-6 au-1] | -680.47 | ± 0.31 |
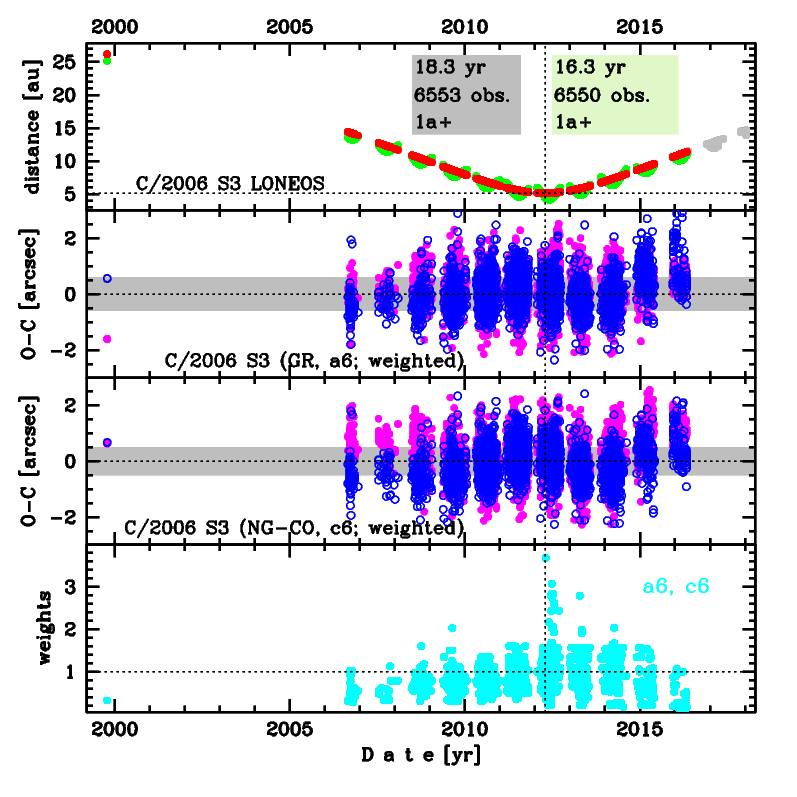
Upper panel: Time distribution of positional observations with corresponding heliocentric (red curve) and geocentric (green curve) distance at which they were taken. The horizontal dotted line shows the perihelion distance for a given comet whereas vertical dotted line — the moment of perihelion passage.
Middle panel(s): O-C diagram for a given solution (sometimes in comparison to another solution available in CODE), where residuals in right ascension are shown using magenta dots and in declination by blue open circles.
Lowest panel: Relative weights for a given data set(s).
Middle panel(s): O-C diagram for a given solution (sometimes in comparison to another solution available in CODE), where residuals in right ascension are shown using magenta dots and in declination by blue open circles.
Lowest panel: Relative weights for a given data set(s).
| non-gravitational parameters | ||
|---|---|---|
| A1 [10-8au/day2] | 1.5886 | ± 0.0364 |
| A2 [10-8au/day2] | 1.7137 | ± 0.0405 |
| A3 [10-8au/day2] | 0.17961 | ± 0.00655 |
| m | -2.00 | |
| n | 3.000 | |
| k | -2.6000 | |
| r0 [au] | 10.000 | |
| α | 0.0100 | |