C/2007 O1 LINEAR
more info
Comet C/2007 O1 was discovered on 17 July 2007 with Lincoln Laboratory Near-Earth Asteroid Research project; that is about 1.5 month after its perihelion passage. However, in the data sequence, we have more than one-year gap in positional measurements. This is due to the fact that the object was initially discovered as an asteroid, and more than a year later it was rediscovered as a comet. It was observed until 13 November 2007 (see picture).
Comet had its closest approach to the Earth on 5 July 2007 (1.886 au), less than 2 weeks before its discovery and a month after perihelion passage.
Solution given here is based on data spanning over 1.62 yr in a range of heliocentric distances: 4.99 au – 2.877 au (perihelion) – 2.91 au.
This Oort spike comet suffers moderate planetary perturbations during its passage through the planetary system and these perturbations lead to escape the comet from the solar system on hyperbolic orbit (see future barycentric orbit). Non-gravitational accelerations are completely not detectable in its motion during the period covered by positional observations.
See also Królikowska and Dybczyński 2013 and Królikowska 2020.
| solution description | ||
|---|---|---|
| number of observations | 178 | |
| data interval | 2006 04 02 – 2007 11 13 | |
| data type | almost all measurements after perihelion (POST++) | |
| data arc selection | entire data set (STD) | |
| range of heliocentric distances | 4.99 au – 2.88 au (perihelion) – 2.91 au | |
| detectability of NG effects in the comet's motion | NG effects not determinable | |
| type of model of motion | GR - gravitational orbit | |
| data weighting | YES | |
| number of residuals | 336 | |
| RMS [arcseconds] | 0.47 | |
| orbit quality class | 1a | |
| orbital elements (heliocentric ecliptic J2000) | ||
|---|---|---|
| Epoch | 2007 05 20 | |
| perihelion date | 2007 06 03.29884235 | ± 0.00102725 |
| perihelion distance [au] | 2.87671670 | ± 0.00000778 |
| eccentricity | 1.00498808 | ± 0.00001343 |
| argument of perihelion [°] | 159.400786 | ± 0.000267 |
| ascending node [°] | 116.235193 | ± 0.000027 |
| inclination [°] | 24.379508 | ± 0.000055 |
| reciprocal semi-major axis [10-6 au-1] | -1,733.95 | ± 4.66 |
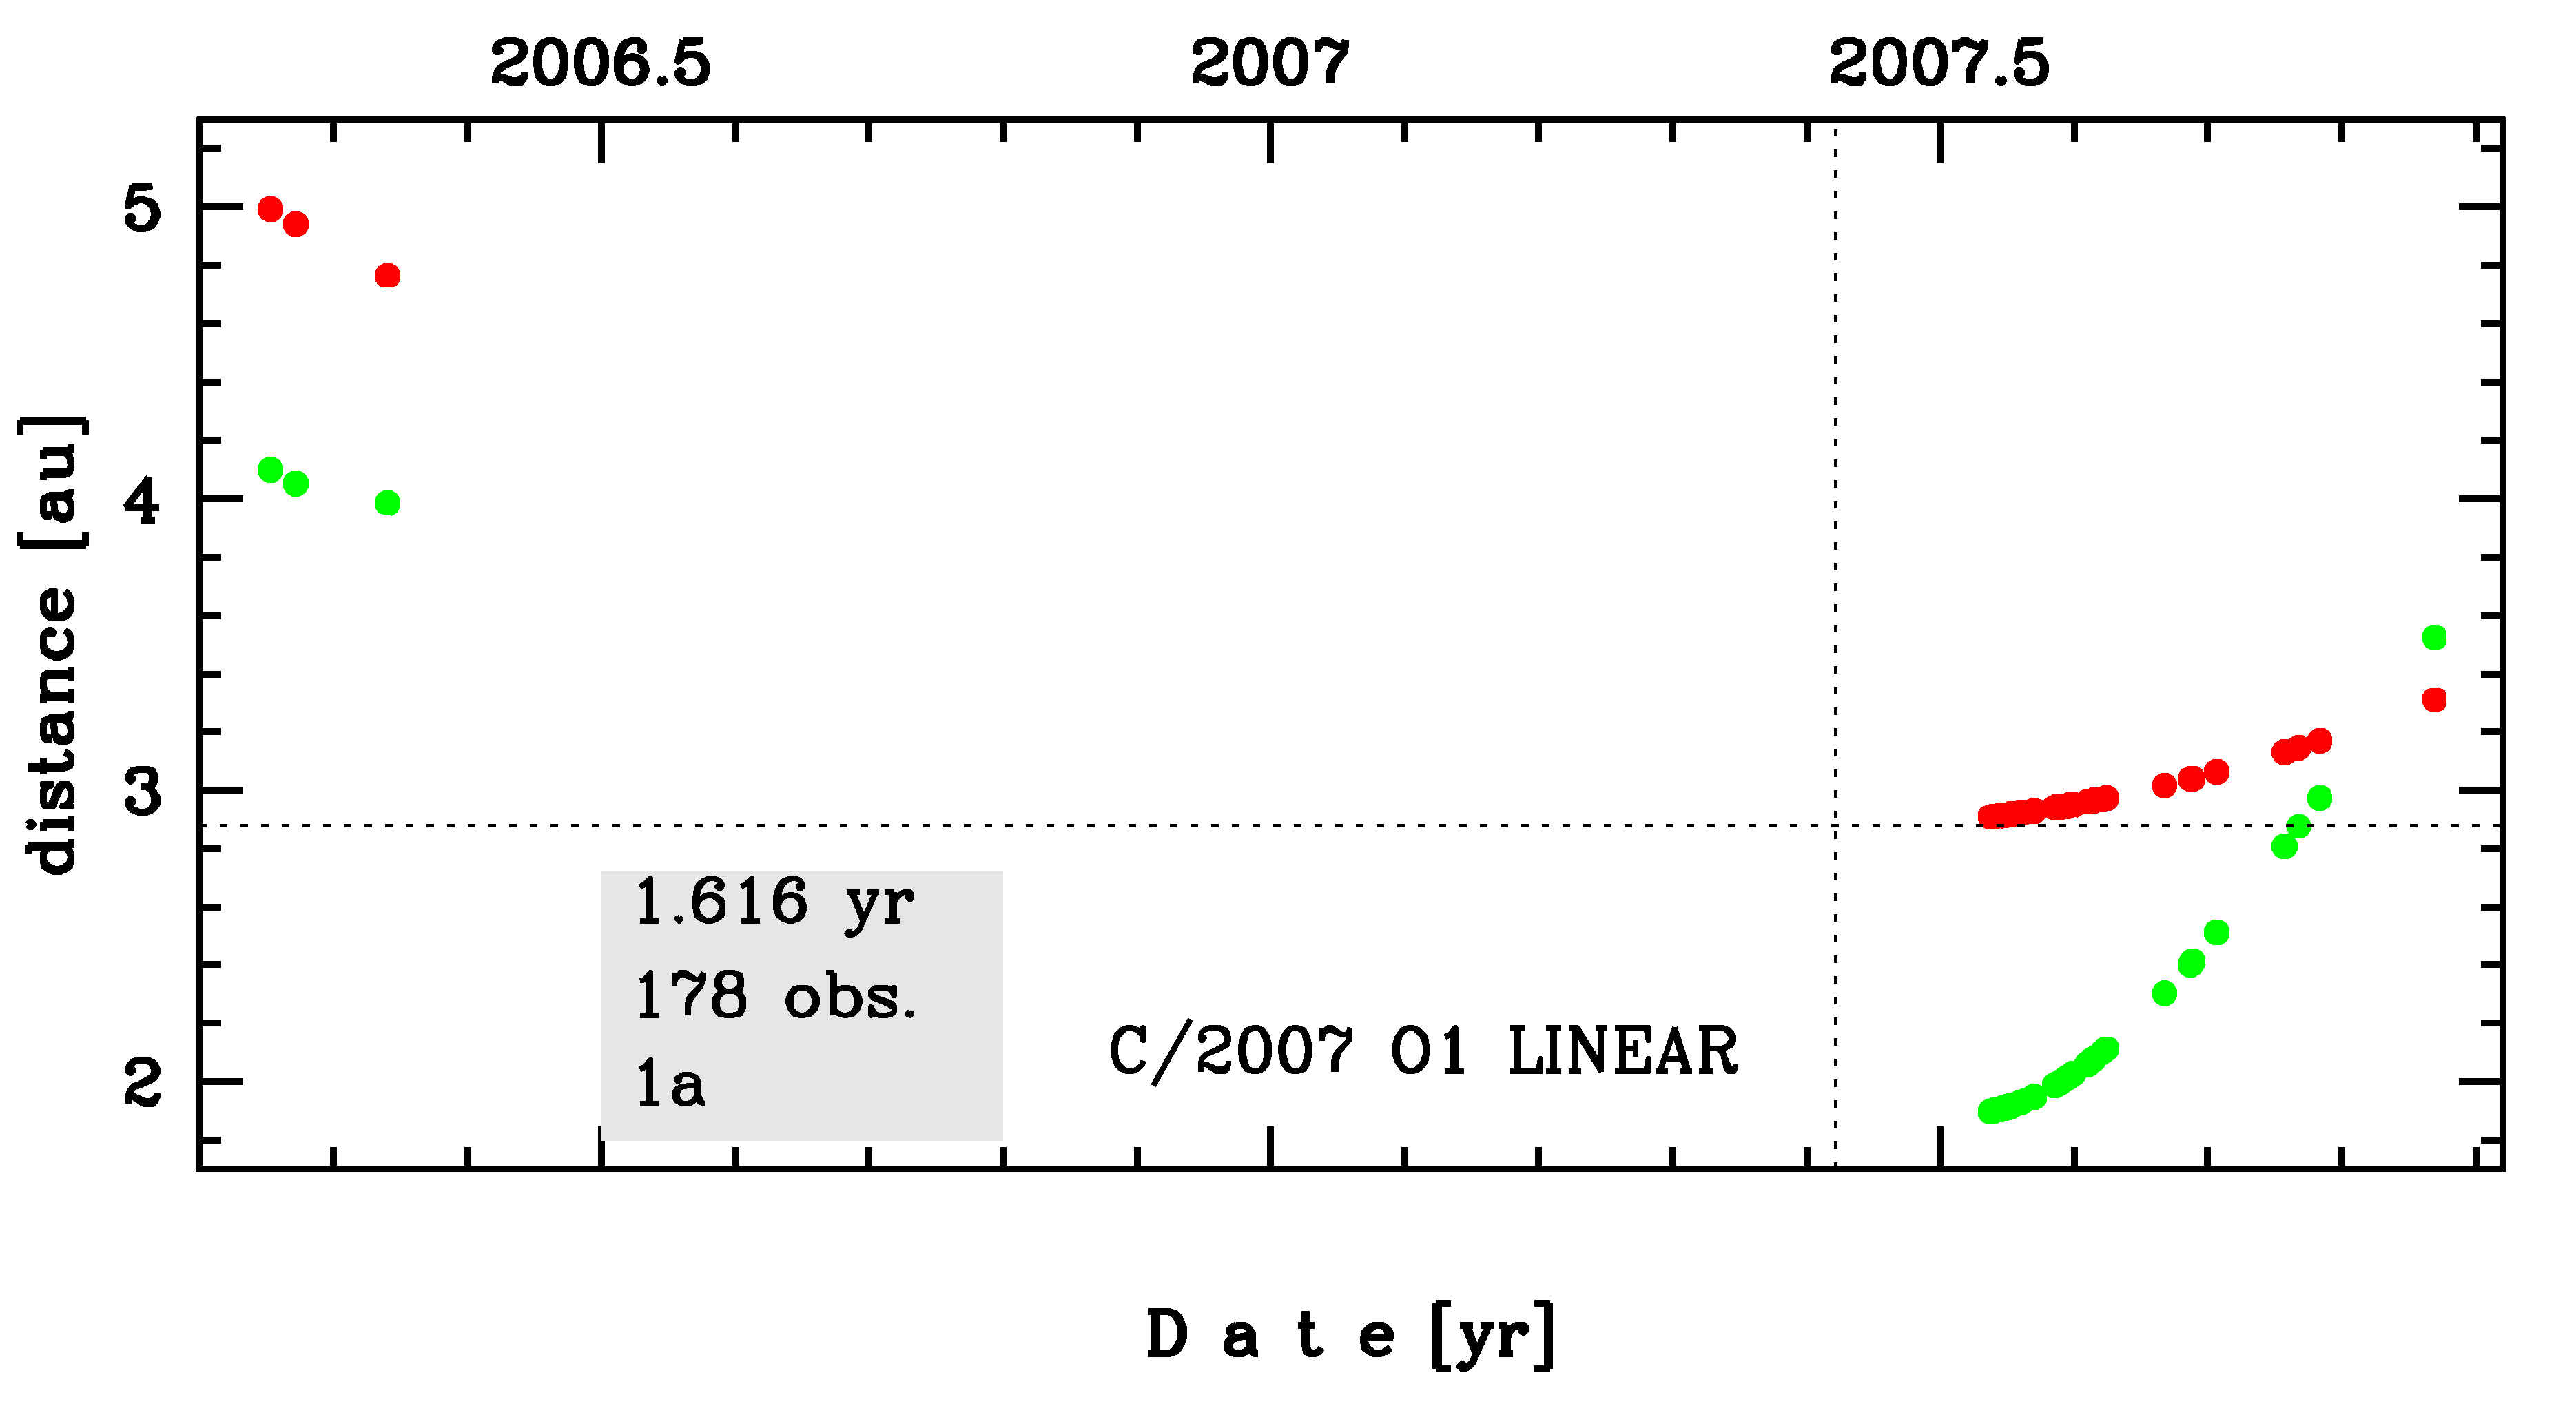
Time distribution of positional observations with corresponding heliocentric (red curve) and geocentric (green curve) distance at which they were taken. The horizontal dotted line shows the perihelion distance for a given comet whereas vertical dotted line — the moment of perihelion passage.