C/2009 R1 McNaught
more info
Comet C/2009 R1 was discovered on 9 September 2009 by Robert H. McNaught (Catalina Sky Survey); that is about 10 months before its perihelion passage. Next, pre-discovery images of the comet taken on 20 July, 1 August, and 18 August, 2009 (during Siding Spring Survey) were found. This comet of a very small perihelion distance of 0.405 au was observed only before its perihelion passage and was lost soon after it, some speculations about its disintegration were reported by individual observers.
Comet had its closest approach to the Earth on 15 June 2010 (1.135 au), about 2 weeks before its perihelion passage.
Although only the pre-perihelion data are available, C/2009 R1 exhibits nongravitational effects strongly manifesting in positional data fitting.
Solutions given here is based on data spanning over 0.942 yr in a range of heliocentric distances from 5.06 au to 0.41 au.
This Oort spike comet suffers small planetary perturbations during its passage to perihelion. C/2009 R1 might not have survived its perihelion passage; however, the future orbits are presented in this database.
See also Królikowska and Dybczyński 2013, Sekanina 2019, and Królikowska 2020.
| solution description | ||
|---|---|---|
| number of observations | 777 | |
| data interval | 2009 07 20 – 2010 06 29 | |
| data type | observed only before perihelion (PRE) | |
| data arc selection | entire data set (STD) | |
| range of heliocentric distances | 5.06 au – 0.41au | |
| type of model of motion | NS - non-gravitational orbits for standard g(r) | |
| data weighting | YES | |
| number of residuals | 1501 | |
| RMS [arcseconds] | 0.51 | |
| orbit quality class | 1b | |
| orbital elements (heliocentric ecliptic J2000) | ||
|---|---|---|
| Epoch | 2010 04 11 | |
| perihelion date | 2010 07 02.67567848 | ± 0.00023241 |
| perihelion distance [au] | 0.40501839 | ± 0.00000260 |
| eccentricity | 1.00035974 | ± 0.00000121 |
| argument of perihelion [°] | 130.700107 | ± 0.000199 |
| ascending node [°] | 322.622313 | ± 0.000032 |
| inclination [°] | 77.034332 | ± 0.000192 |
| reciprocal semi-major axis [10-6 au-1] | -888.22 | ± 2.98 |
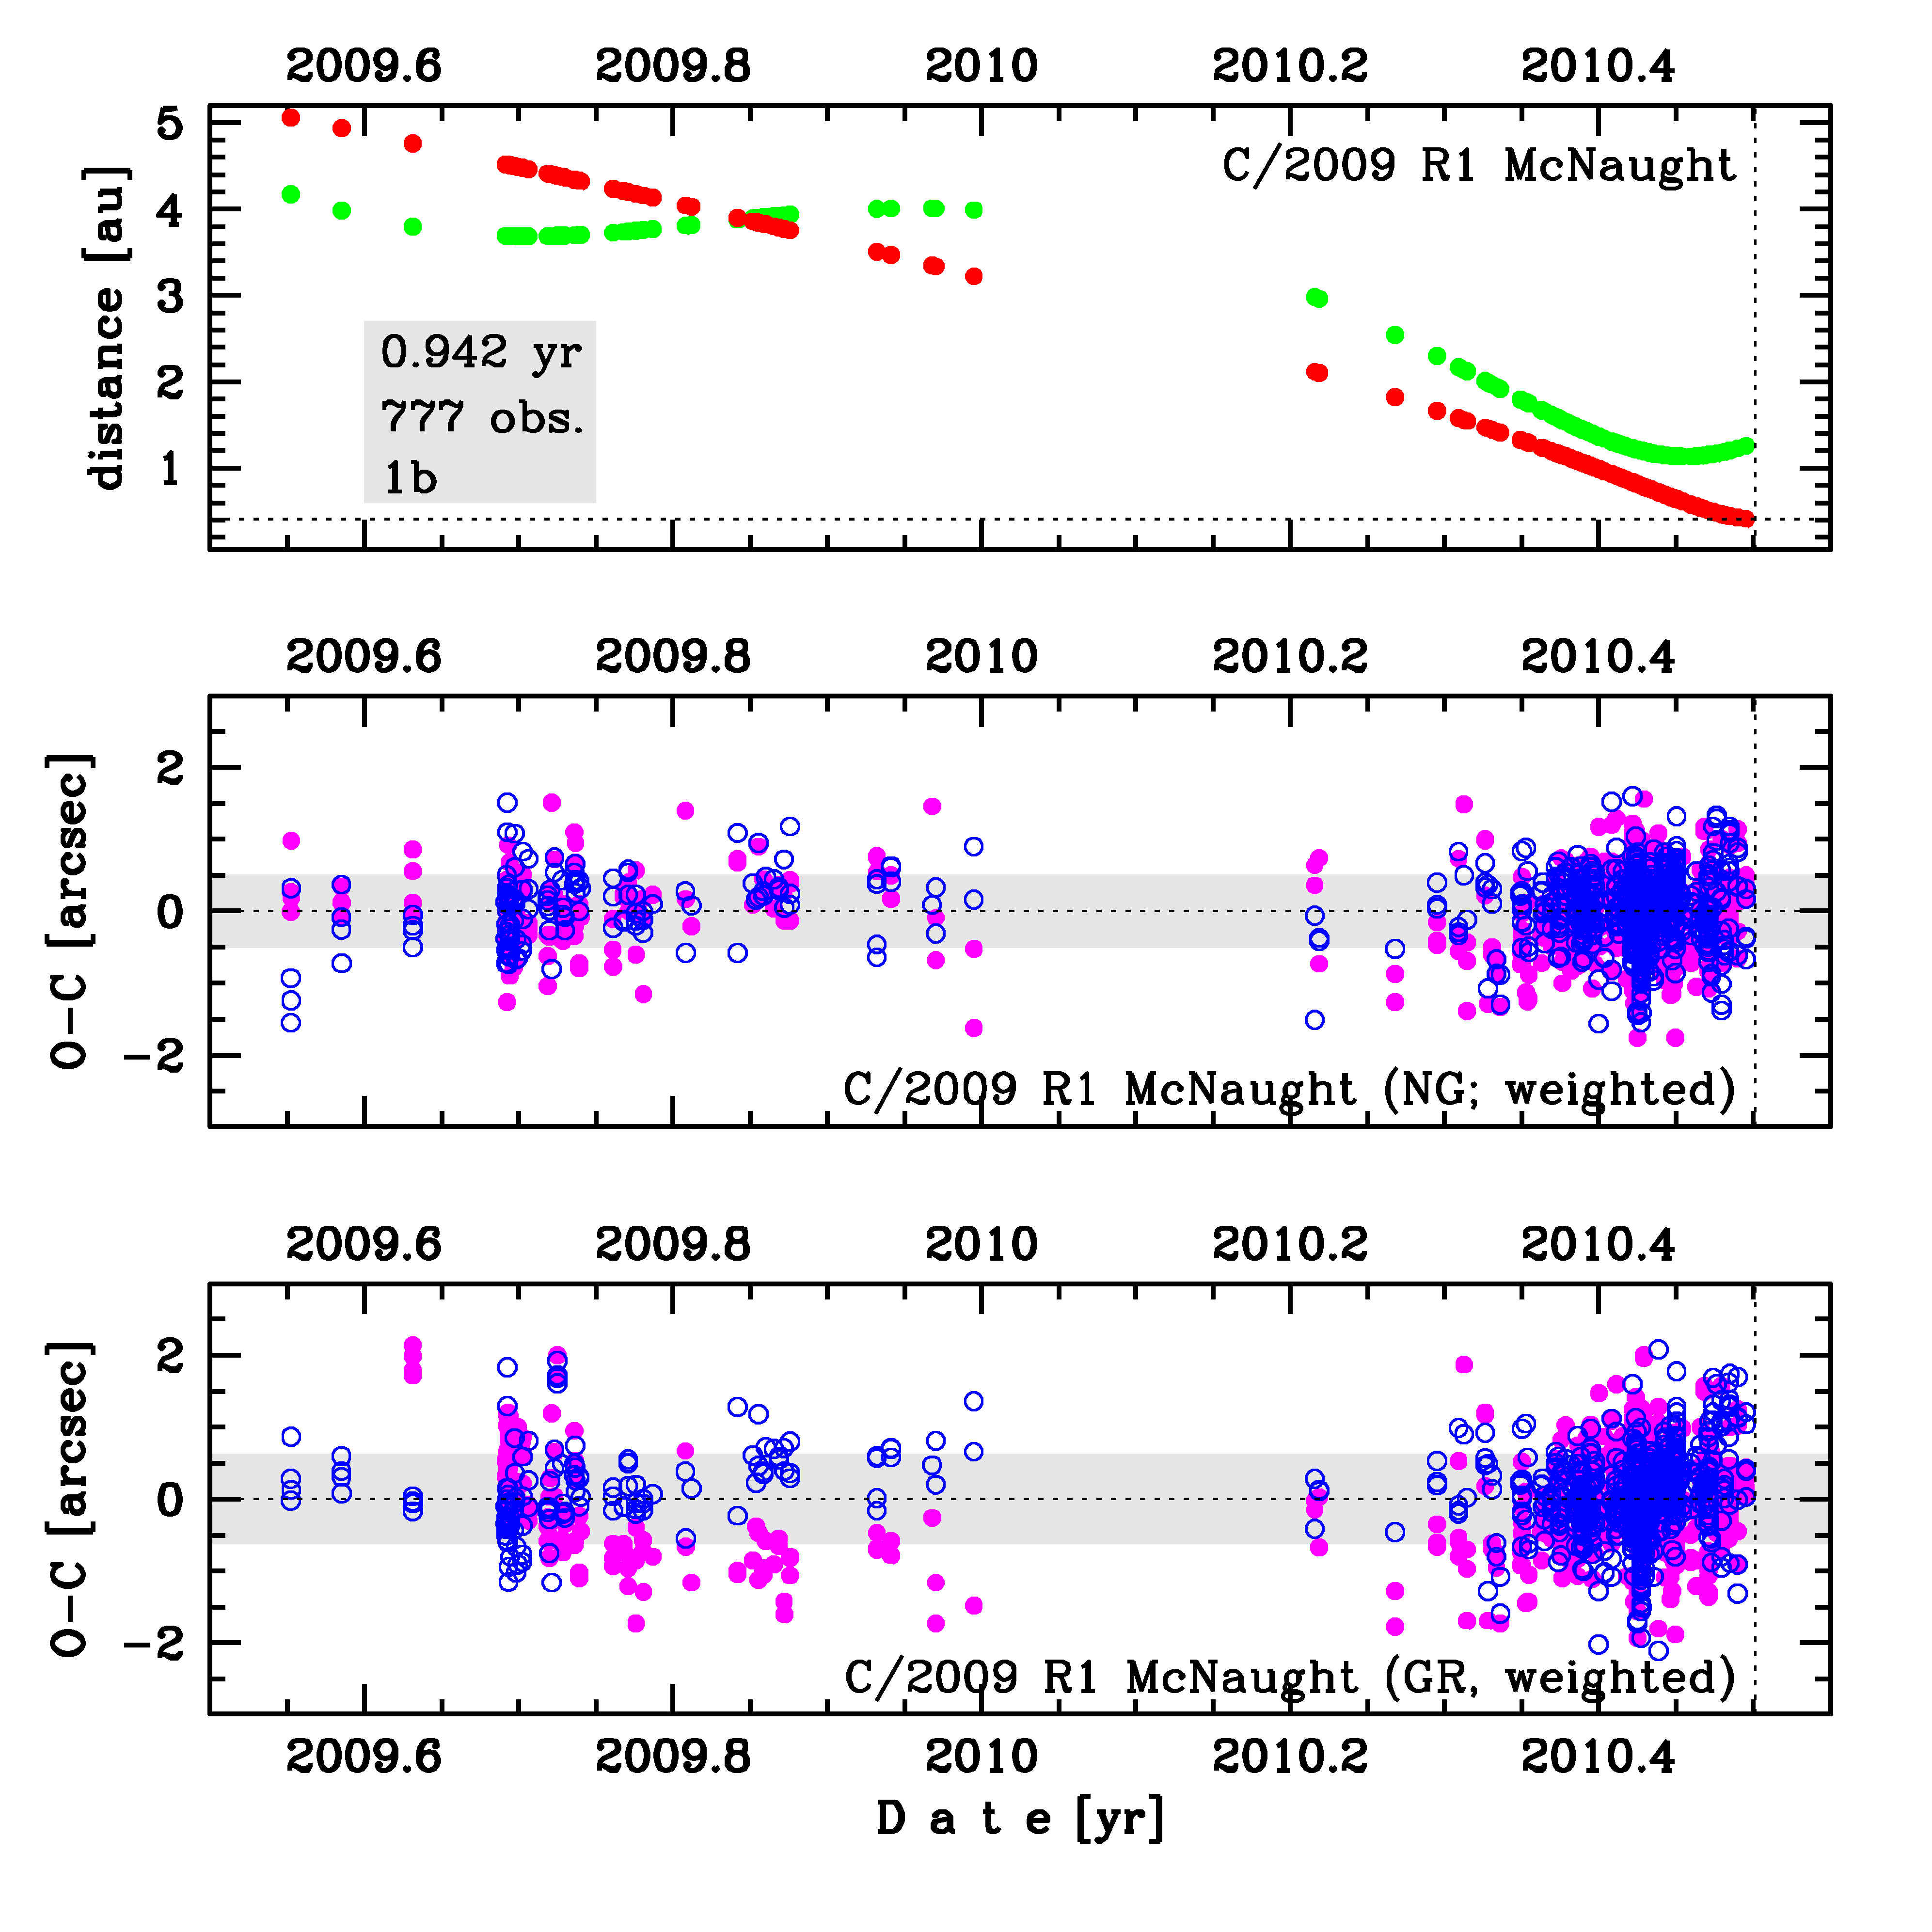
Upper panel: Time distribution of positional observations with corresponding heliocentric (red curve) and geocentric (green curve) distance at which they were taken. The horizontal dotted line shows the perihelion distance for a given comet whereas vertical dotted line — the moment of perihelion passage.
Lower panel (panels): O-C diagram for this(two) solution (solutions) given in this database, where residuals in right ascension are shown using magenta dots and in declination by blue open circles.
Lower panel (panels): O-C diagram for this(two) solution (solutions) given in this database, where residuals in right ascension are shown using magenta dots and in declination by blue open circles.
| non-gravitational parameters | ||
|---|---|---|
| A1 [10-8au/day2] | 5.8084 | ± 0.4902 |
| A2 [10-8au/day2] | -1.4267 | ± 0.3594 |
| A3 [10-8au/day2] | 0.77974 | ± 0.20755 |
| m | -2.15 | |
| n | 5.093 | |
| k | -4.6142 | |
| r0 [au] | 2.808 | |
| α | 0.1113 | |