C/1971 E1 Toba
more info
Comet C/1971 E1 was discovered on 7 March 1971 by Kenji Toba (Tsuchiura, Ibaraki, Japan), that is more than a month before its perihelion passage. It was observed until 9 September 1971 [Kronk, Cometography: Volume 5].
Comet had its closest approach to the Earth on 9 June 1971 (0.724 au), about a month and 3 weeks after its perihelion passage.
Solutions given here are based on data spanning over 0.504 yr in a range of heliocentric distances: 1.37 au – 1.233 au (perihelion) – 2.41 au.
This comet suffers moderate planetary perturbations during its passage through the planetary system; according to preferred solution these perturbations lead to escape the comet from the planetary zone on a hyperbolic orbit (see future barycentric orbits).
See also Królikowska 2020.
| solution description | ||
|---|---|---|
| number of observations | 137 | |
| data interval | 1971 03 09 – 1971 09 09 | |
| data type | perihelion within the observation arc (FULL) | |
| data arc selection | entire data set (STD) | |
| range of heliocentric distances | 1.37 au – 1.23 au (perihelion) – 2.41 au | |
| type of model of motion | NS - non-gravitational orbits for standard g(r) | |
| data weighting | YES | |
| number of residuals | 275 | |
| RMS [arcseconds] | 1.22 | |
| orbit quality class | 2b | |
| orbital elements (barycentric ecliptic J2000) | ||
|---|---|---|
| Epoch | 1665 04 02 | |
| perihelion date | 1971 04 17.55264536 | ± 0.00216483 |
| perihelion distance [au] | 1.23189116 | ± 0.00028181 |
| eccentricity | 0.99922054 | ± 0.00129831 |
| argument of perihelion [°] | 152.438600 | ± 0.008520 |
| ascending node [°] | 104.053592 | ± 0.000960 |
| inclination [°] | 109.747709 | ± 0.008238 |
| reciprocal semi-major axis [10-6 au-1] | 632.73 | ± 1,054.07 |
| file containing 5001 VCs swarm |
|---|
| 1971e1n2.bmi |
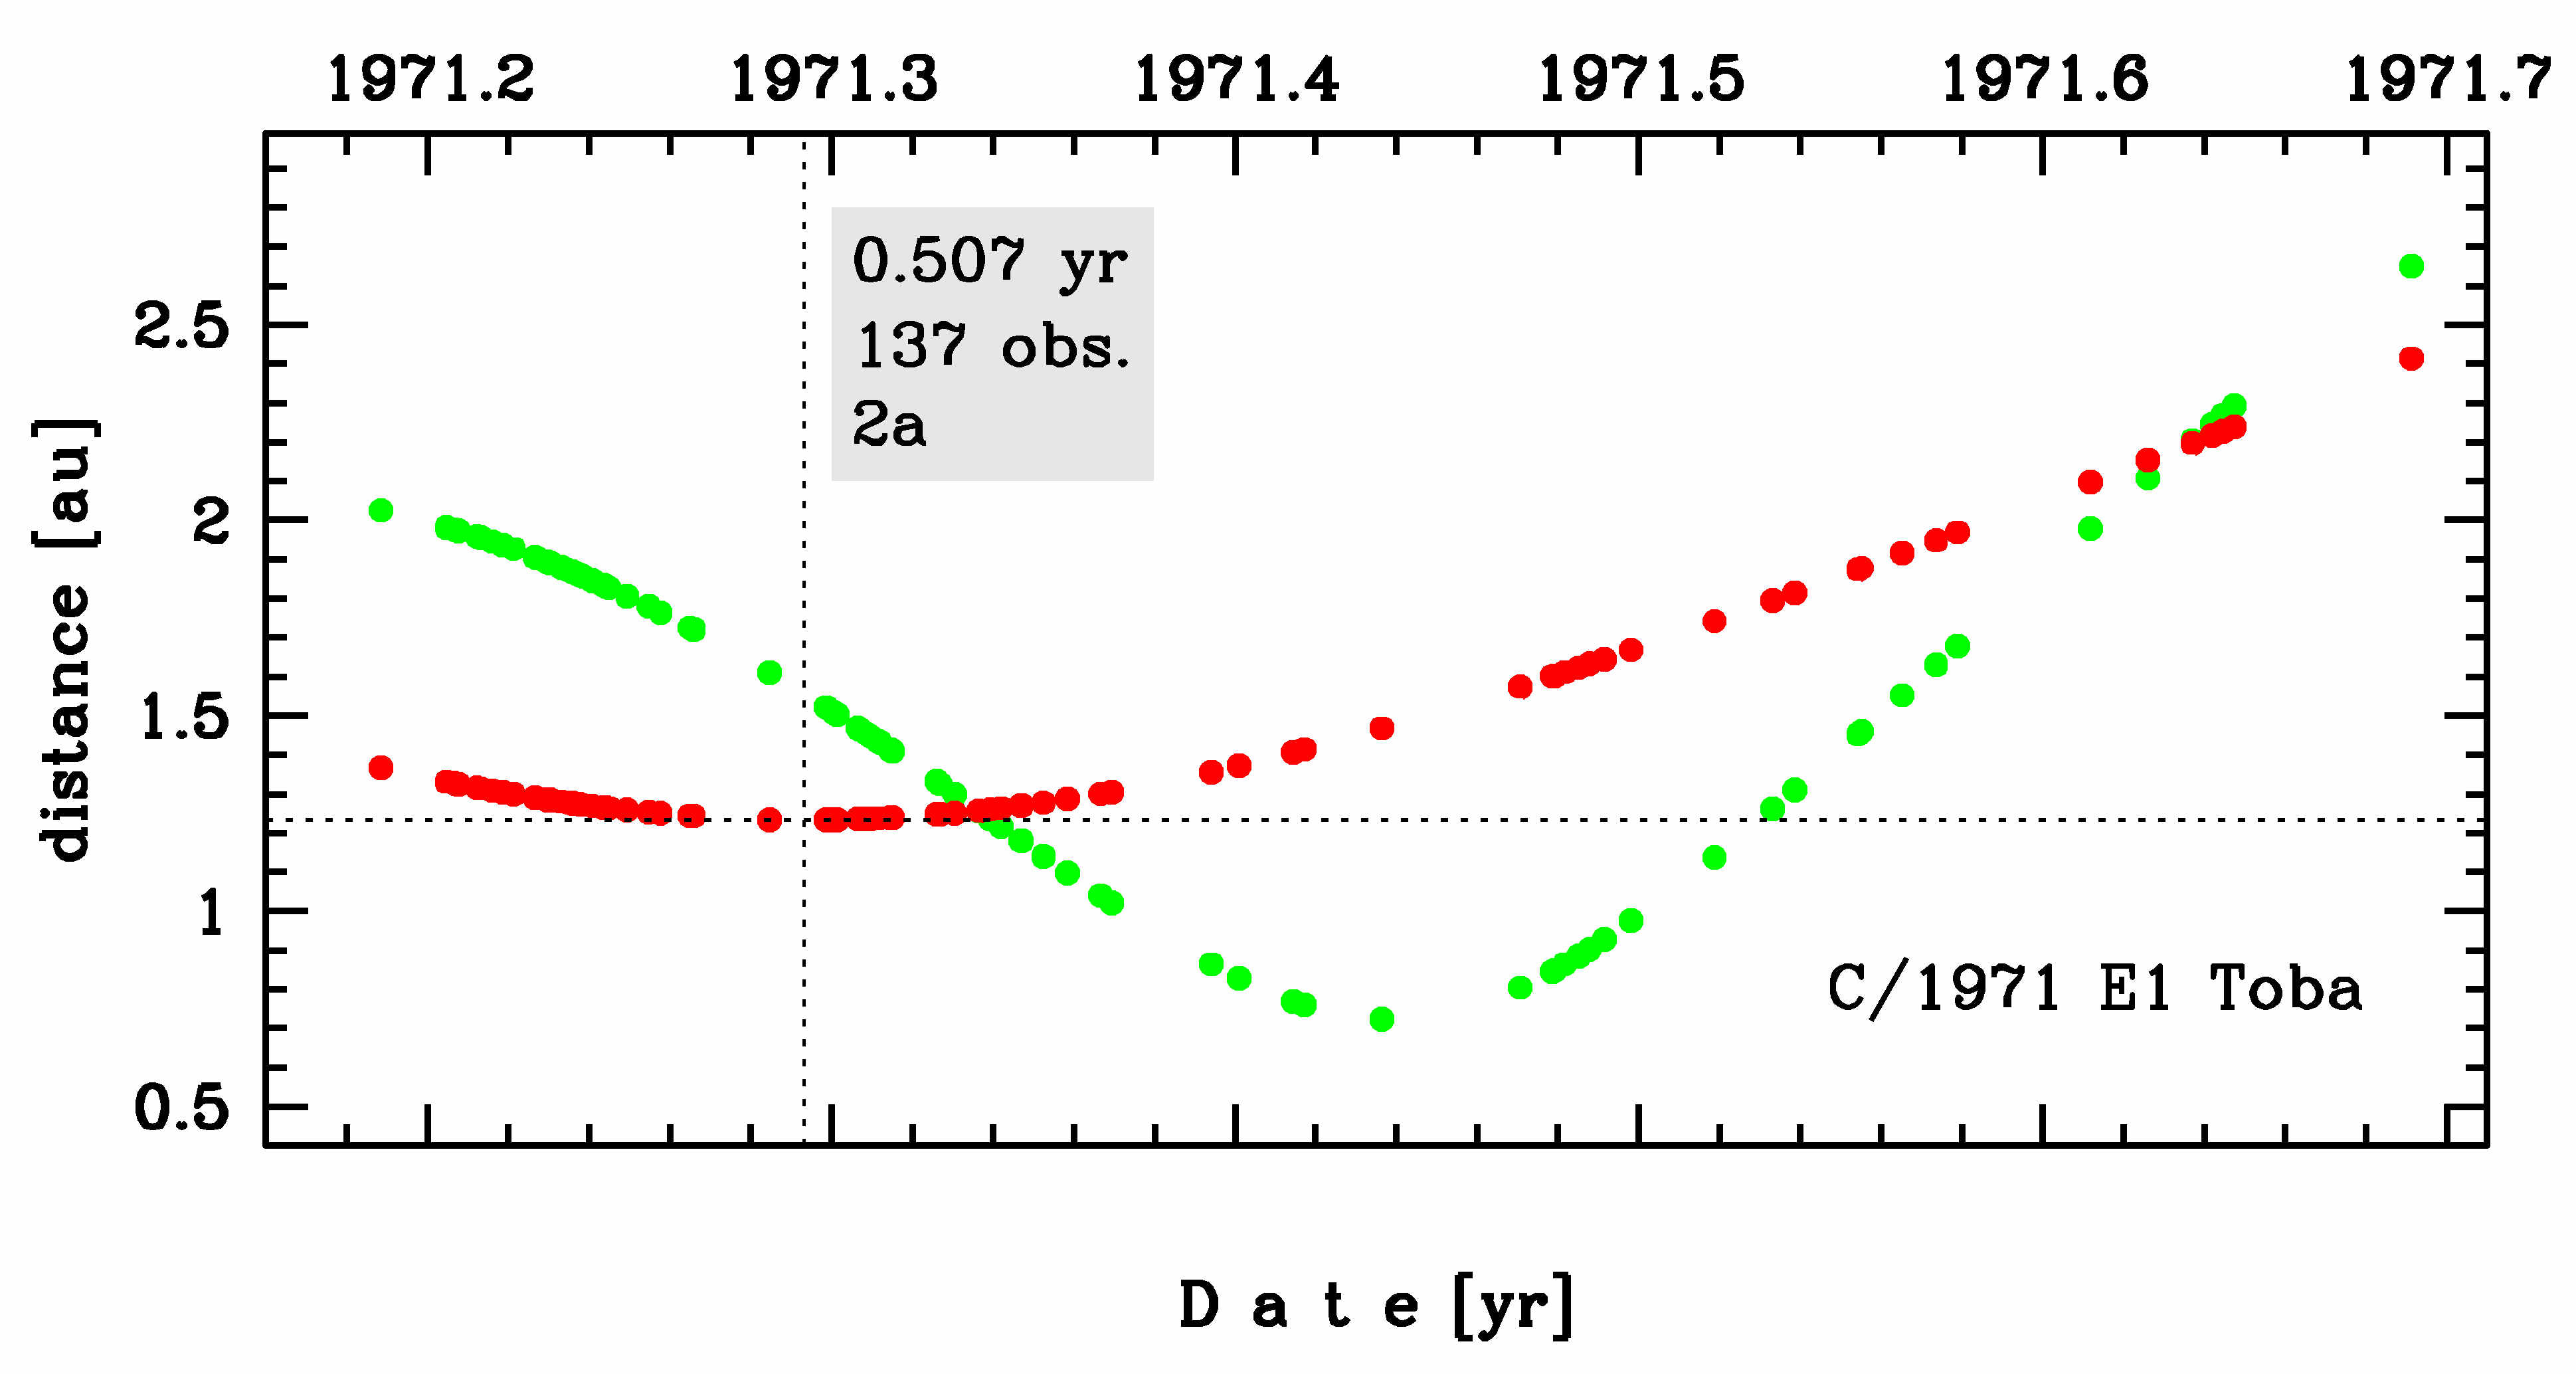
Time distribution of positional observations with corresponding heliocentric (red curve) and geocentric (green curve) distance at which they were taken. The horizontal dotted line shows the perihelion distance for a given comet whereas vertical dotted line — the moment of perihelion passage.
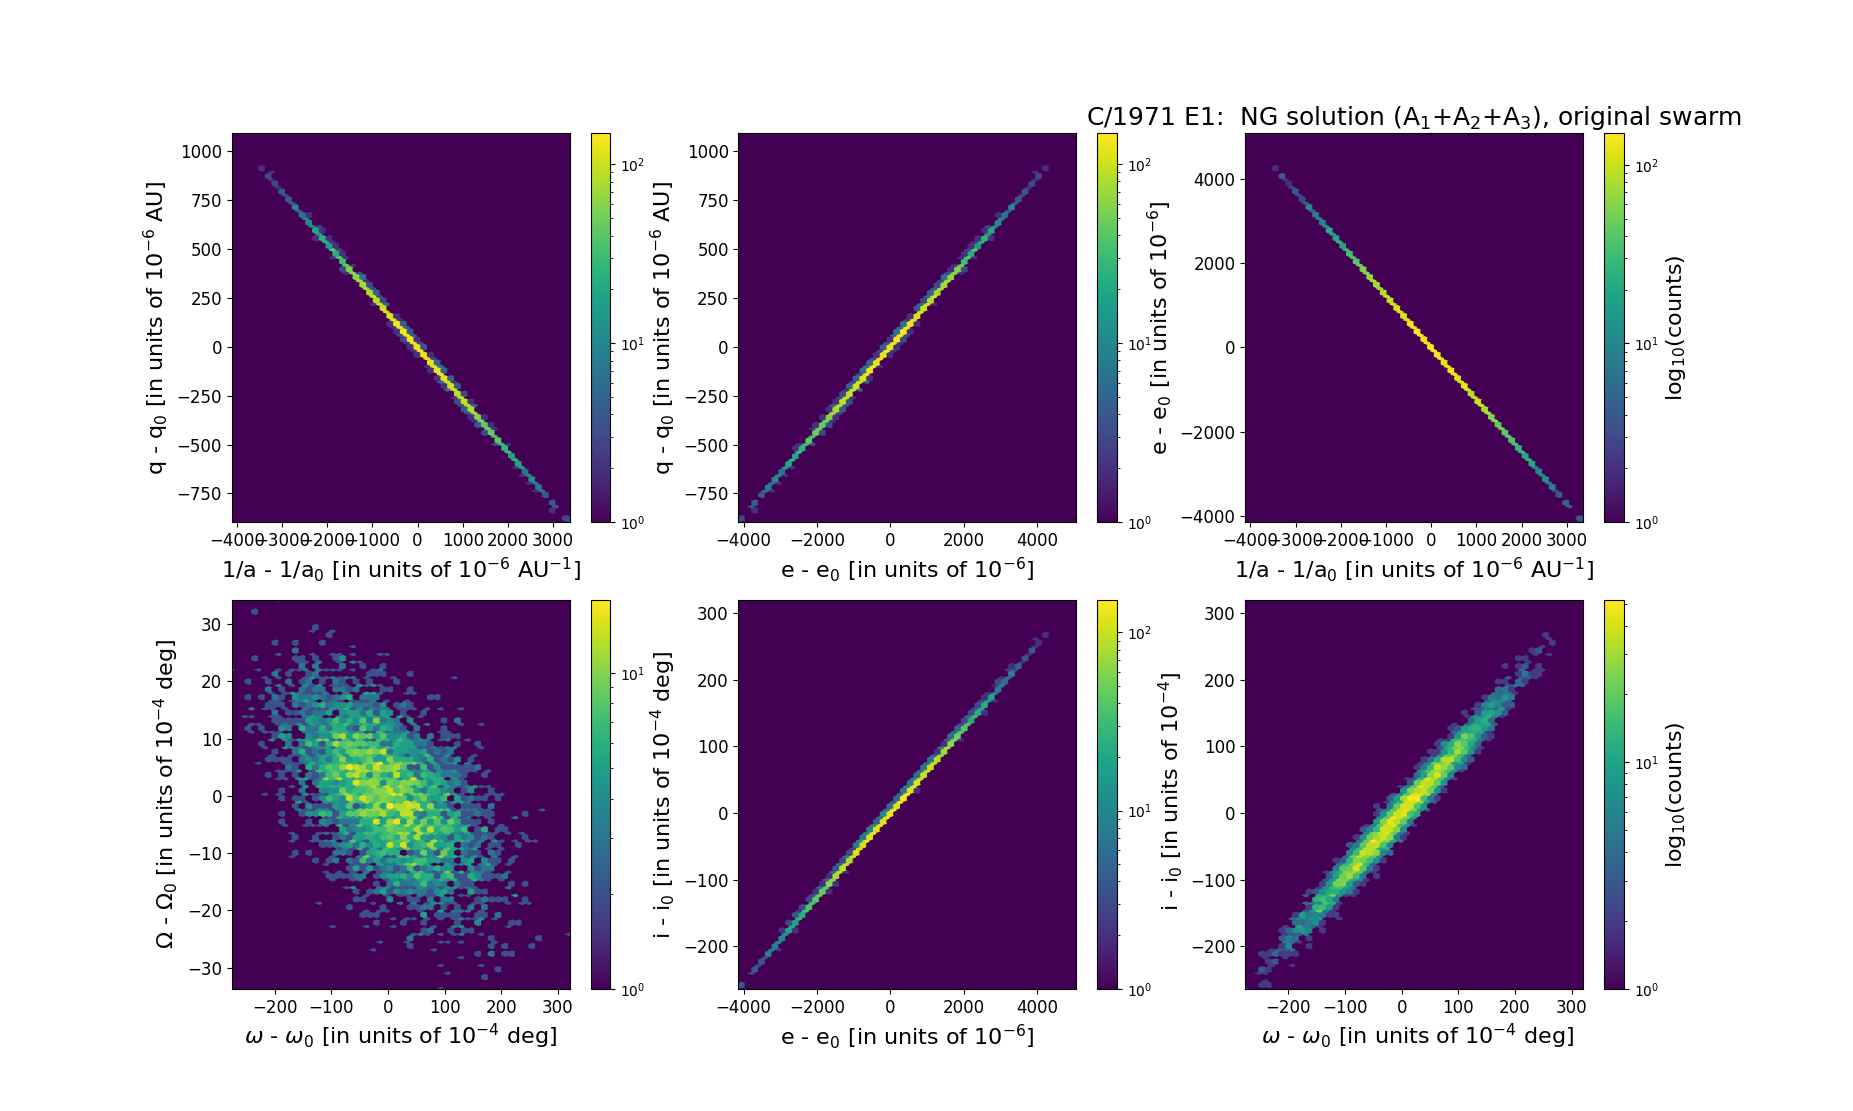
Six 2D-projections of the 6D space of original swarm including 5001 VCs. Each density map is given in logarithmic scale presented on the right in the individual panel.