C/1993 A1 Mueller
more info
Comet C/1993 A1 was discovered on 2 January 1993 by Jean Mueller (Palomar Sky Survey II). Later, a prediscovery image of this comet taken on 26 November 1992 (Catalina Station, Tucson) was found.At the moment of discovery, this comet was a year before its perihelion passage and it was last observed in the mid-August 1994.
Comet had its closest approach to the Earth on 13 November 1993 (1.713 au), 2 months before its perihelion passage.
This is a comet with nongravitational effects strongly manifested in positional data fitting.
Preferred solution given here is based on data spanning over 1.72 yr in a range of heliocentric distances: 4.89 au – 1.94 au (perihelion) – 3.19 au.
This Oort spike comet suffers moderate planetary perturbations during its passage through the planetary system; these perturbations lead to escape the comet on hyperbolic orbit from the planetary zone.See also Królikowska 2020.
| solution description | ||
|---|---|---|
| number of observations | 658 | |
| data interval | 1992 11 26 – 1994 01 08 | |
| data arc selection | data generally limited to pre-perihelion (PRE) | |
| range of heliocentric distances | 4.89 au – 1.94au | |
| type of model of motion | NC - non-gravitational orbits for symmetric CO-g(r)-like function | |
| data weighting | YES | |
| number of residuals | 1306 | |
| RMS [arcseconds] | 1.15 | |
| orbit quality class | 1a | |
| previous orbit statistics, both Galactic and stellar perturbations were taken into account | ||
|---|---|---|
| no. of returning VCs in the swarm | 25 | |
| no. of escaping VCs in the swarm | 4976 | |
| no. of hyperbolas among escaping VCs in the swarm | 4105 | * |
| previous reciprocal semi-major axis [10-6 au-1] | -23.30 – -9.34 – 3.69 | |
| previous perihelion distance [au] | 6.8 – 8.6 – 12 | |
| previous aphelion distance [103 au] | 160 – 440 – 3100 | |
| synchronous stop epoch [Myr] | -1.94 | S |
| percentage of VCs with qprev < 10 | 76 | |
| percentage of VCs with 10 < qprev < 20 | 24 | |
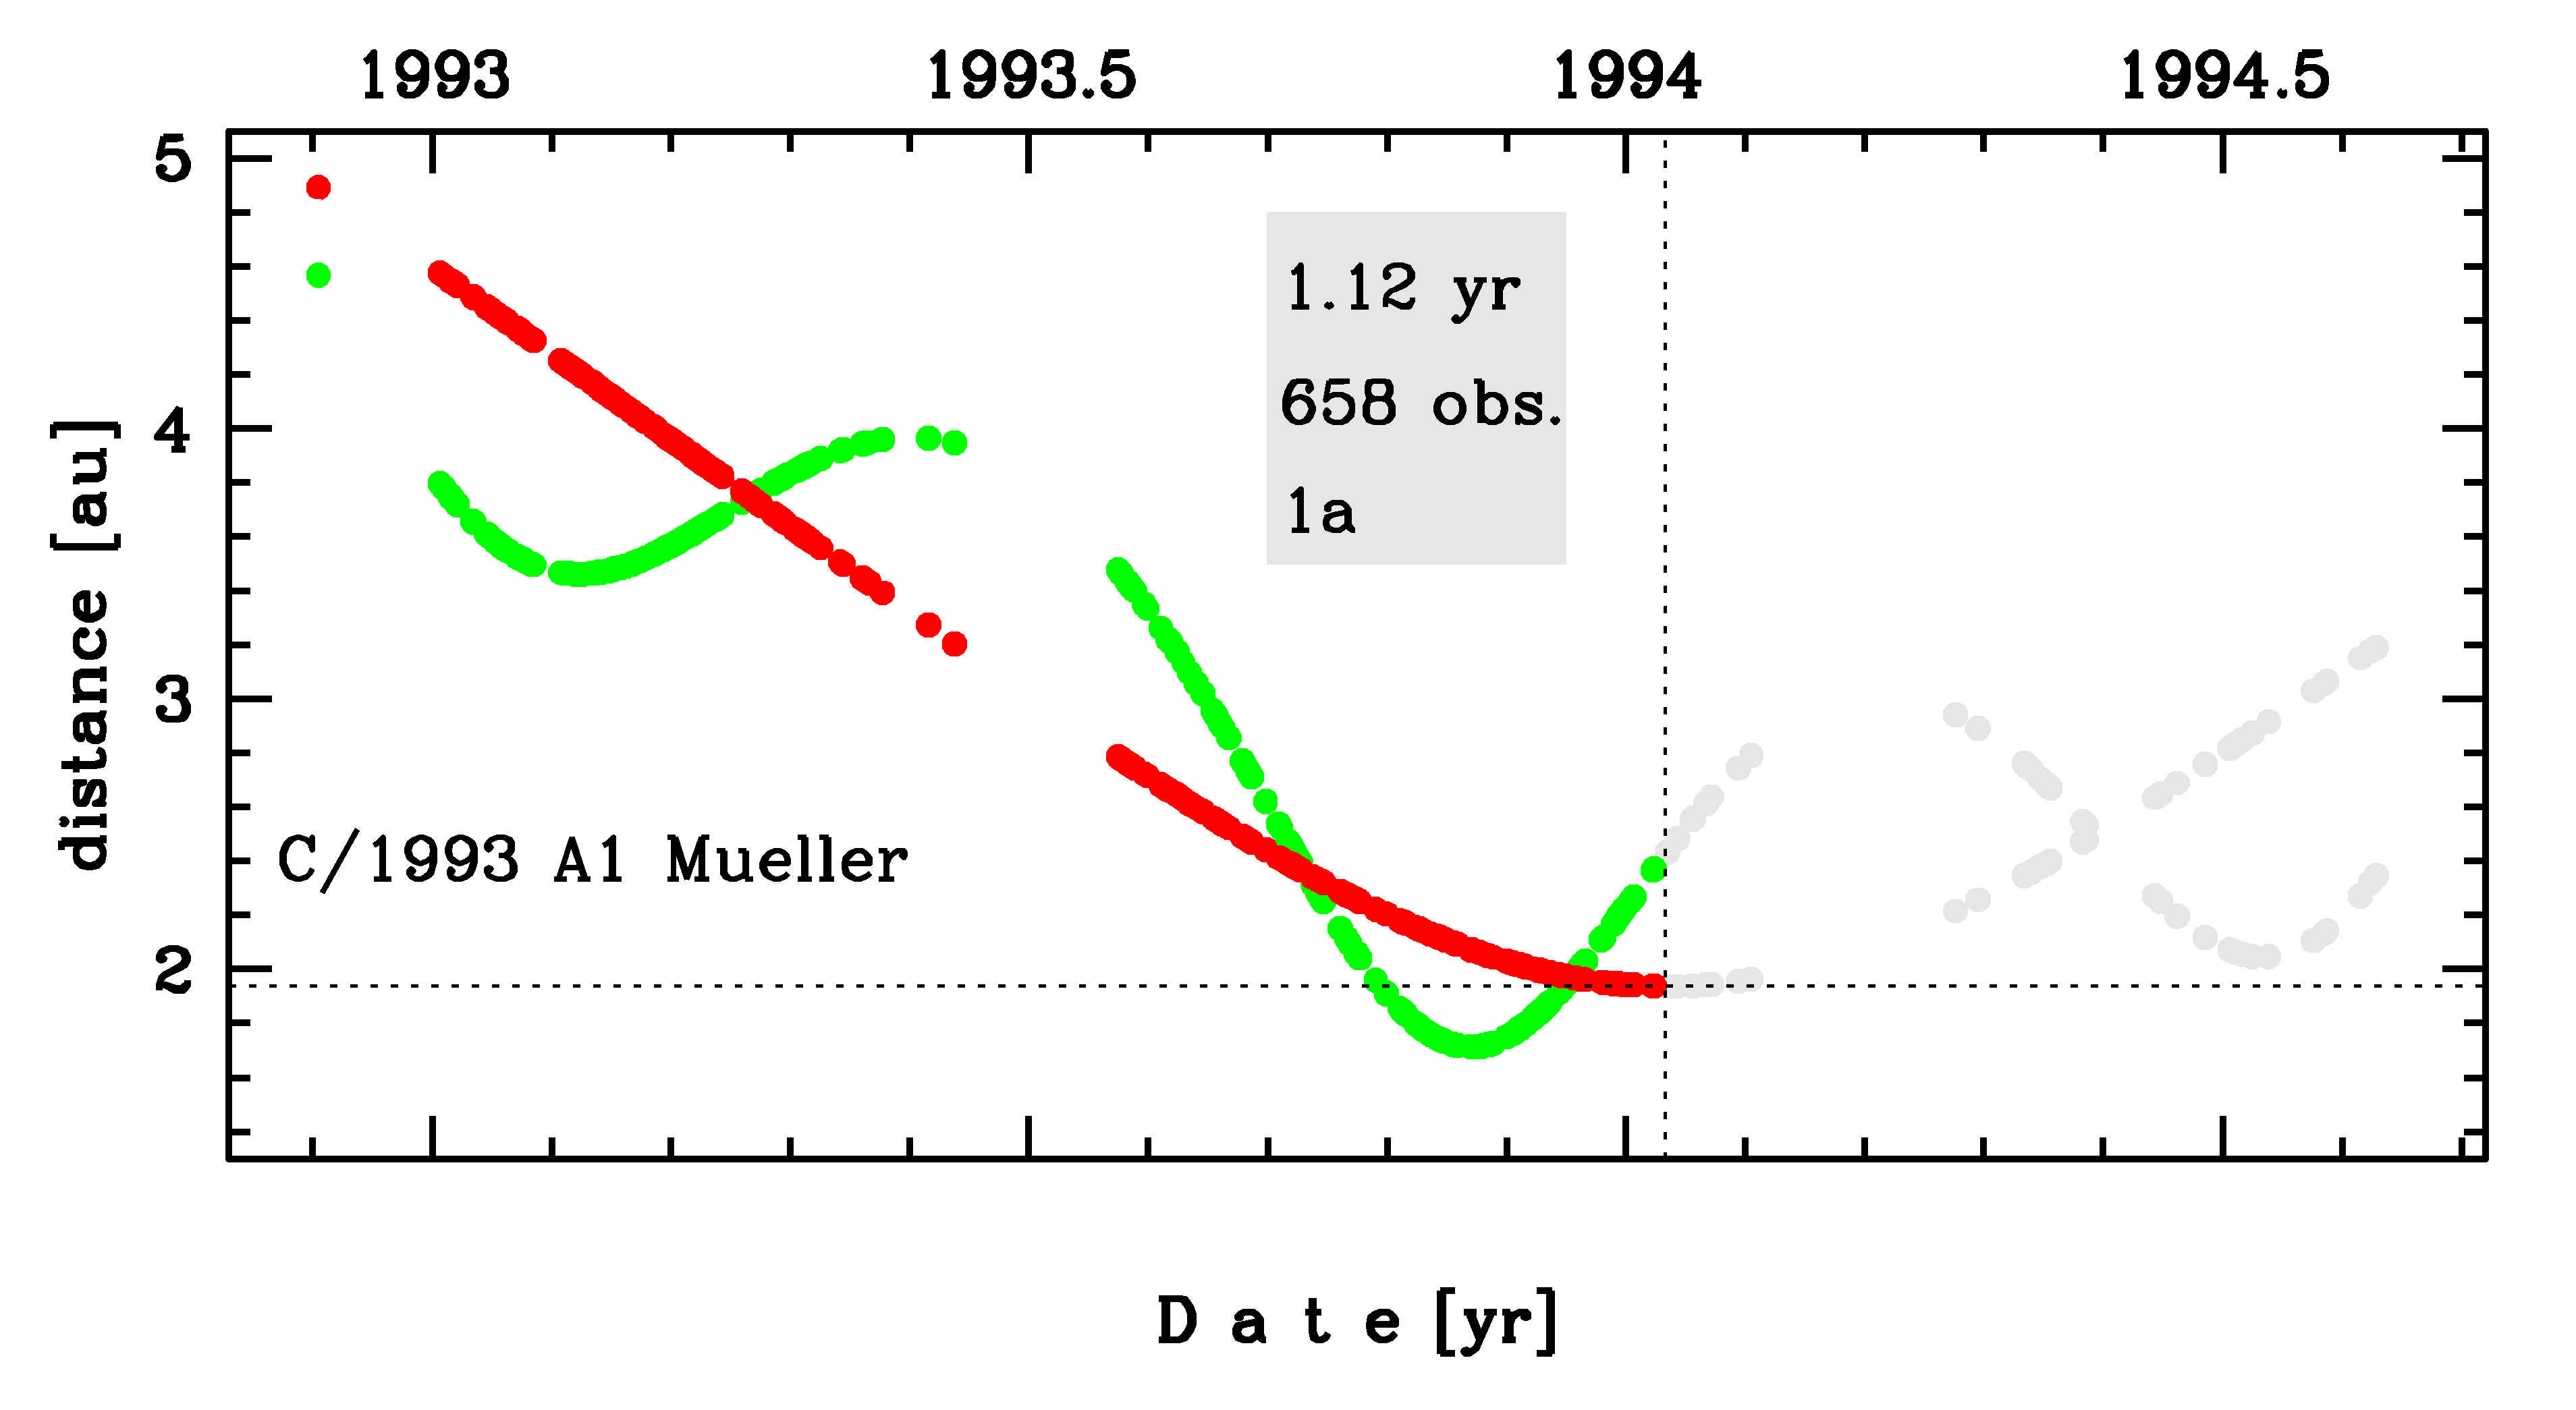
Time distribution of positional observations with corresponding heliocentric (red curve) and geocentric (green curve) distance at which they were taken. The horizontal dotted line shows the perihelion distance for a given comet whereas vertical dotted line — the moment of perihelion passage.
| previous orbit statistics, here only the Galactic tide has been included | ||
|---|---|---|
| no. of returning VCs in the swarm | 40 | |
| no. of escaping VCs in the swarm | 4961 | |
| no. of hyperbolas among escaping VCs in the swarm | 4076 | * |
| previous reciprocal semi-major axis [10-6 au-1] | -22.68 – -9.00 – 3.88 | |
| previous perihelion distance [au] | 5.8 – 6.9 – 8.2 | |
| previous aphelion distance [103 au] | 160 – 450 – 2900 | |
| synchronous stop epoch [Myr] | -1.99 | S |
| percentage of VCs with qprev < 10 | 100 | |