C/1996 E1 NEAT
more info
Comet C/1996 E1 was discovered on 15 March 1996 by Near-Earth-Asteroid Tracking Team (Jet Propulsion Laboratory), that is about 4.5 months before its perihelion passage.This comet was last observed in the mid-October 1996.
Comet had its closest approach to the Earth on 25 September 1996 (1.168 au), about 2 months after its perihelion passage.
This is a comet with nongravitational effects strongly manifested in positional data fitting.
Solutions given here are based on data spanning over 0.578 yr in a range of heliocentric distances: 2.31 au – 1.36 au (perihelion) – 1.76 au.
This Oort spike comet suffers rather moderate planetary perturbations during its passage through the planetary system; these perturbations lead to a more tight future orbit.
See also Królikowska 2014 and Królikowska 2020.
| solution description | ||
|---|---|---|
| number of observations | 249 | |
| data interval | 1996 03 15 – 1996 10 12 | |
| data type | significantly more measurements before perihelion (PRE+) | |
| data arc selection | entire data set (STD) | |
| range of heliocentric distances | 2.31 au – 1.36 au (perihelion) – 1.76 au | |
| type of model of motion | NS - non-gravitational orbits for standard g(r) | |
| data weighting | YES | |
| number of residuals | 492 | |
| RMS [arcseconds] | 0.60 | |
| orbit quality class | 1b | |
| orbital elements (barycentric ecliptic J2000) | ||
|---|---|---|
| Epoch | 2299 09 06 | |
| perihelion date | 1996 07 29.36536200 | ± 0.00136717 |
| perihelion distance [au] | 1.34393416 | ± 0.00002194 |
| eccentricity | 0.99949228 | ± 0.00003302 |
| argument of perihelion [°] | 80.790352 | ± 0.001554 |
| ascending node [°] | 149.918318 | ± 0.000383 |
| inclination [°] | 114.714582 | ± 0.000175 |
| reciprocal semi-major axis [10-6 au-1] | 377.79 | ± 24.57 |
| file containing 5001 VCs swarm |
|---|
| 1996e1n2.bpl |

Time distribution of positional observations with corresponding heliocentric (red curve) and geocentric (green curve) distance at which they were taken. The horizontal dotted line shows the perihelion distance for a given comet whereas vertical dotted line — the moment of perihelion passage.
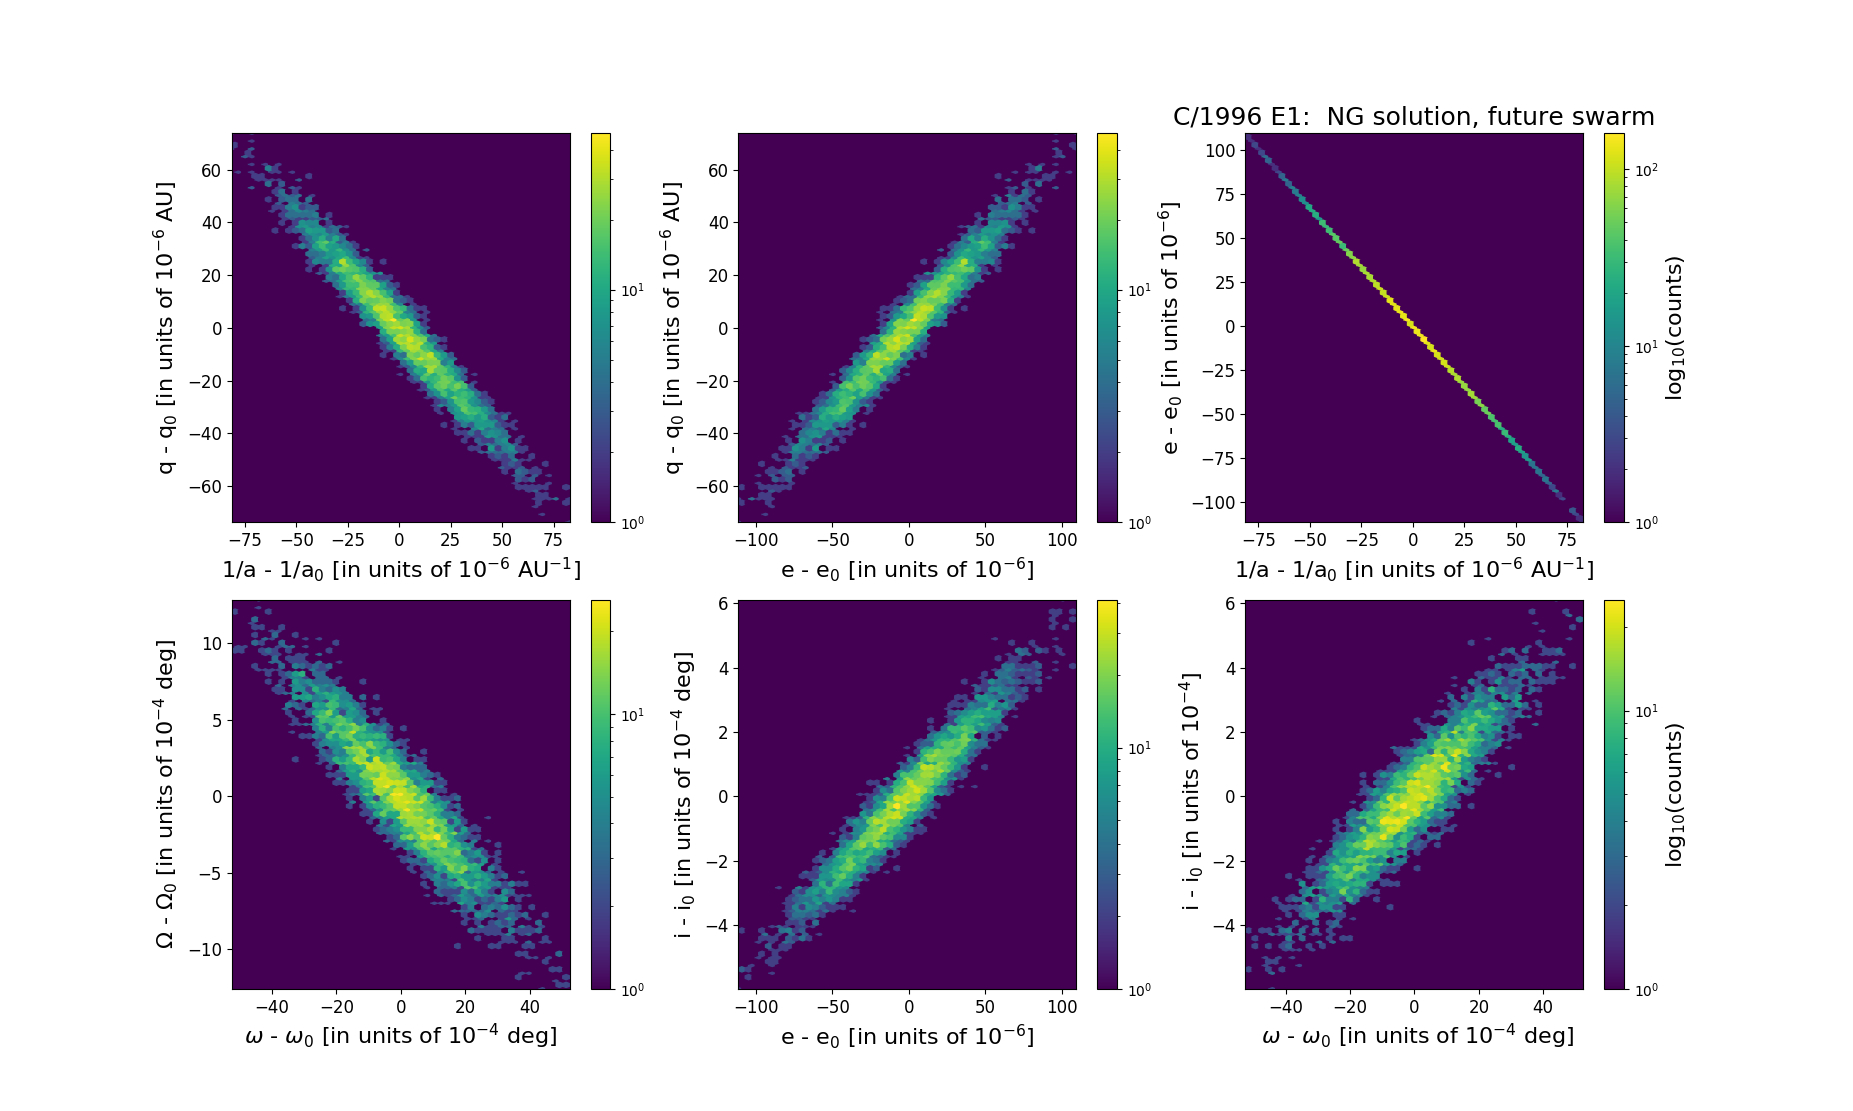
Six 2D-projections of the 6D space of future swarm including 5001 VCs. Each density map is given in logarithmic scale presented on the right in the individual panel.