C/2002 O4 Hoenig
more info
Comet C/2002 O4 was discovered on 22 July 2002 by Sebastian Hoenig (Dossenheim, Germany), that is about two months before its perihelion passage. It was observed until 1 October 2002.
Observers reported that C/2002 O4 started to disintegrate a few days before the perihelion, then faded very rapidly prior to perihelion passage; and in mid-October 2002, it was no longer possible to see this comet. Sekanina (2002) speculated that the comet was undergoing a major outburst near the time of its discovery (27 July 2002) and that a major loss of mass triggered by this episode completed in mid-August. The data arc for this comet is extremely short (two months); however, NG effects are easy detectable in its motion.
Preffered solution given here is based on pre-perihelion data spanning over 0.118 yr in a range of heliocentric distances from 1.43 au to 0.895 au (8 September 2002).
Comet had its closest approach to the Earth on 10 August 2002 (0.650 au), about 2 weeks after its discovery.
The NG orbit obtained from the full data arc gives negative original 1/a, whereas the NG orbit derived using a shorter data arc (see preferred orbit) results in a closed original orbit with semimajor axis shorter than 5000 au, indicating that the orbit of this comet is poorly known.
See also Sekanina 2019 and Królikowska 2020.
| solution description | ||
|---|---|---|
| number of observations | 1148 | |
| data interval | 2002 07 27 – 2002 09 08 | |
| data arc selection | data generally limited to pre-perihelion (PRE) | |
| range of heliocentric distances | 1.43 au – 0.89au | |
| type of model of motion | NS - non-gravitational orbits for standard g(r) | |
| data weighting | NO | |
| number of residuals | 2285 | |
| RMS [arcseconds] | 0.48 | |
| orbit quality class | 3a | |
| orbital elements (heliocentric ecliptic J2000) | ||
|---|---|---|
| Epoch | 2002 10 01 | |
| perihelion date | 2002 10 02.00084116 | ± 0.00154291 |
| perihelion distance [au] | 0.77591871 | ± 0.00002682 |
| eccentricity | 0.99983474 | ± 0.00007947 |
| argument of perihelion [°] | 105.964283 | ± 0.002227 |
| ascending node [°] | 321.031220 | ± 0.000985 |
| inclination [°] | 73.112847 | ± 0.001446 |
| reciprocal semi-major axis [10-6 au-1] | 212.98 | ± 102.42 |
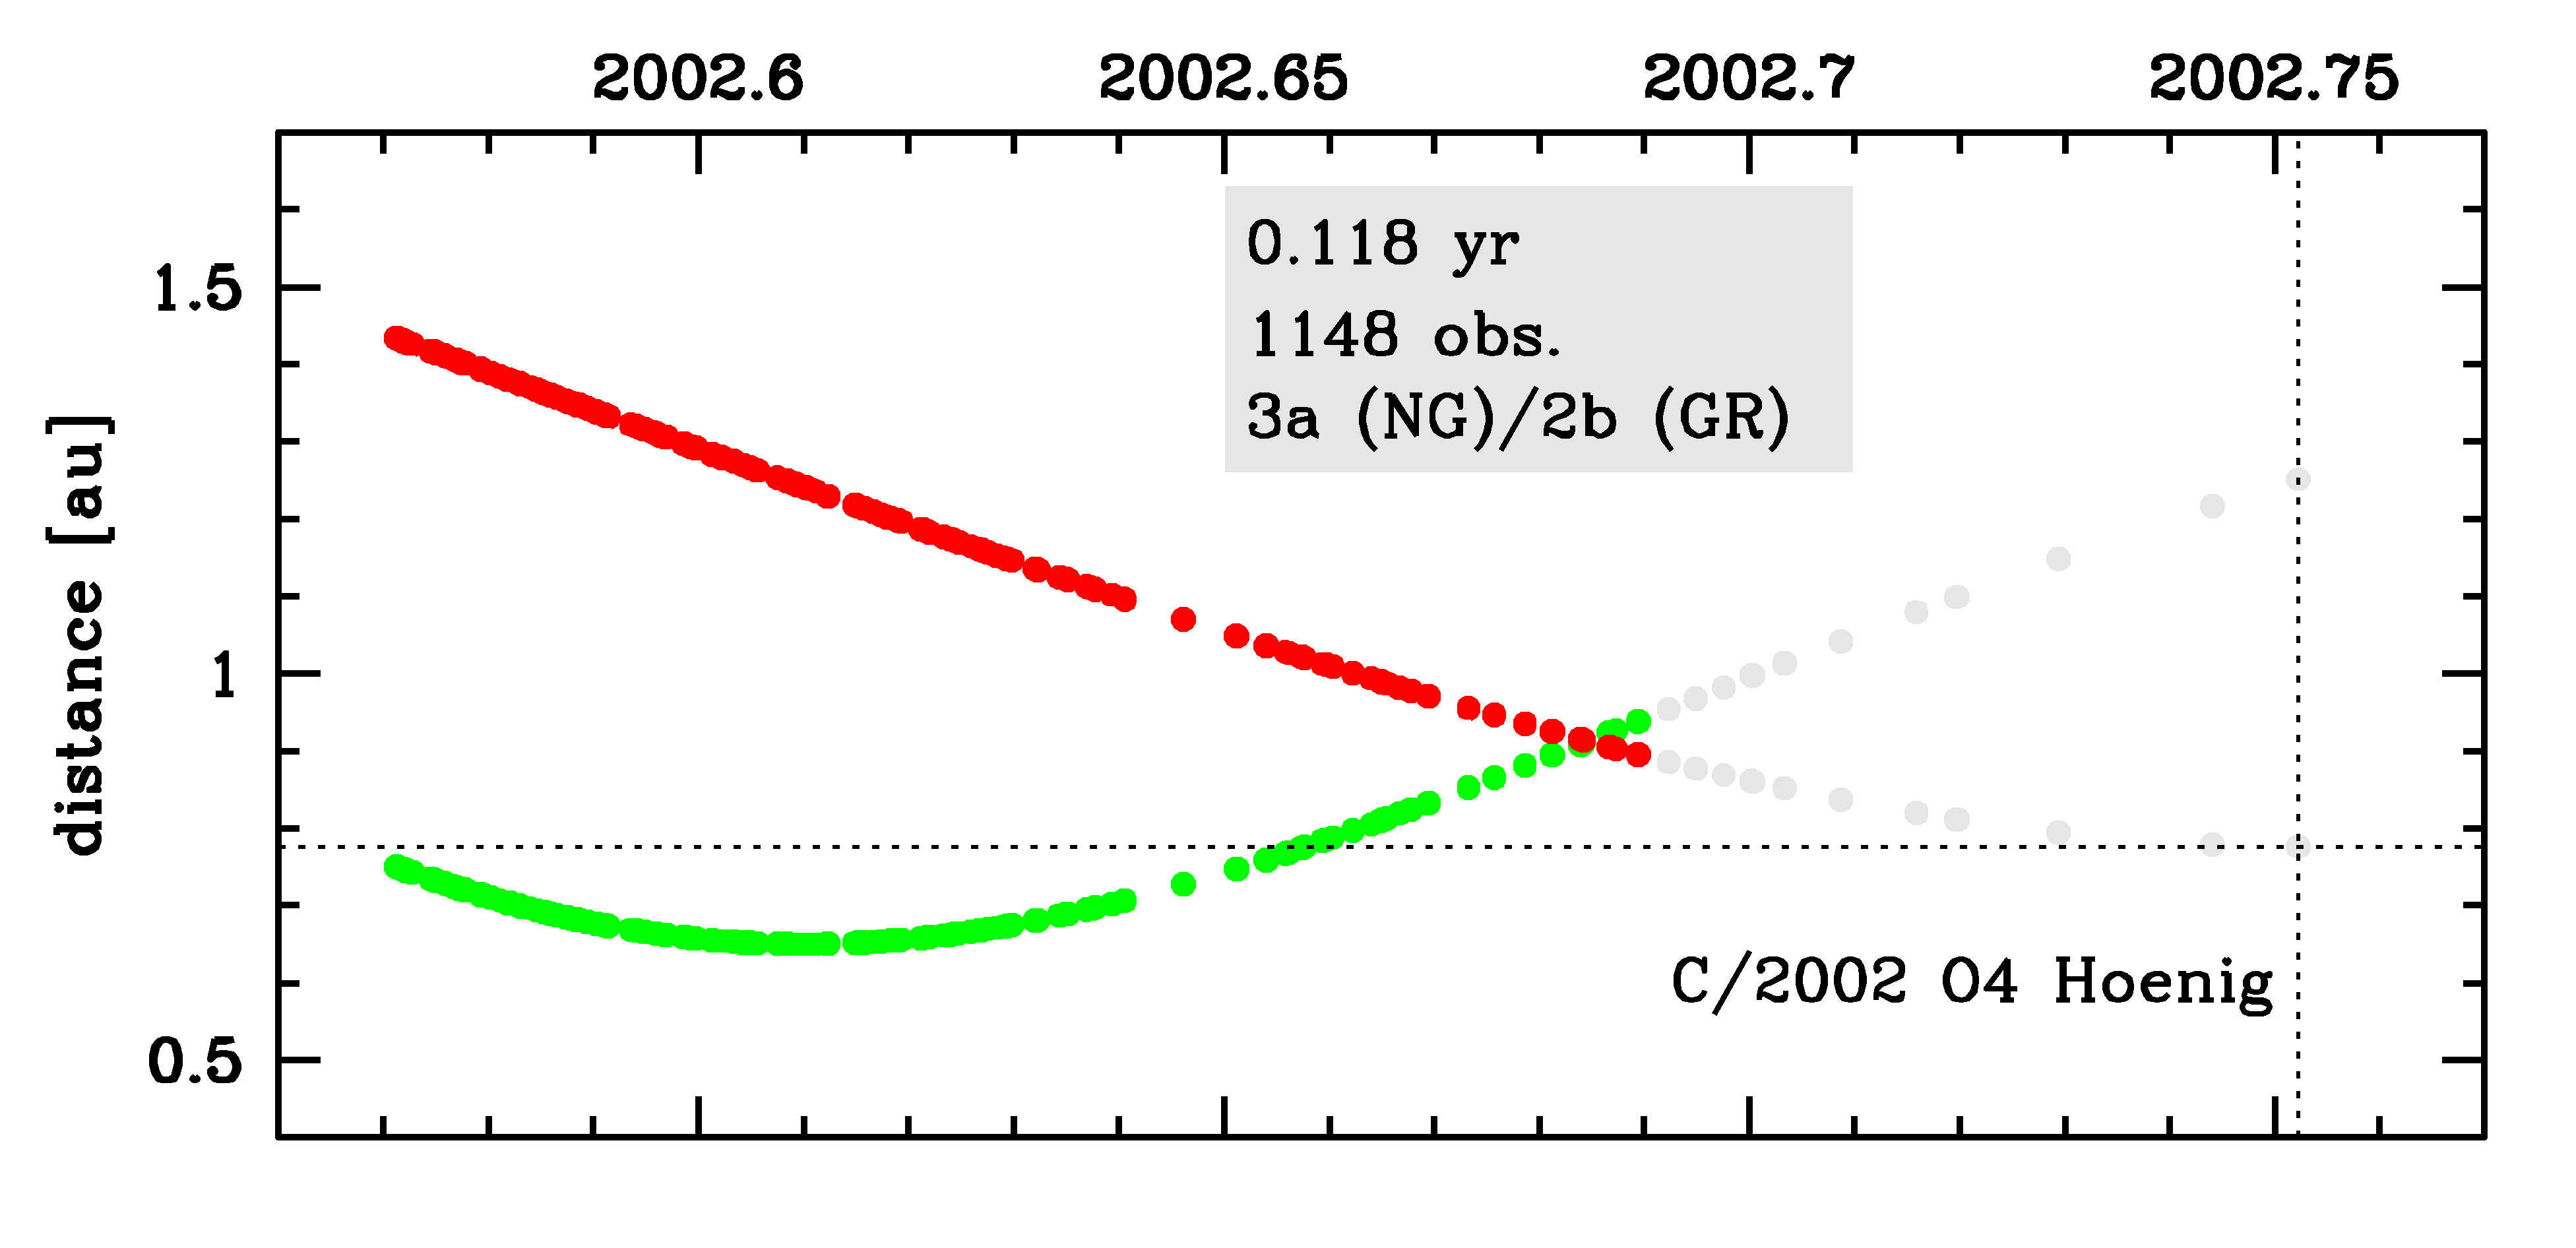
Time distribution of positional observations with corresponding heliocentric (red curve) and geocentric (green curve) distance at which they were taken. The horizontal dotted line shows the perihelion distance for a given comet whereas vertical dotted line — the moment of perihelion passage.
| non-gravitational parameters | ||
|---|---|---|
| A1 [10-8au/day2] | 7.5313 | ± 0.7381 |
| A2 [10-8au/day2] | 0.77826 | ± 0.51416 |
| A3 [10-8au/day2] | 0 | (assumed) |
| m | -2.15 | |
| n | 5.093 | |
| k | -4.6142 | |
| r0 [au] | 2.808 | |
| α | 0.1113 | |