C/2002 O7 LINEAR
more info
Comet C/2002 O7 was discovered on 29 July 2002 with the Lincoln Laboratory Near-Earth Asteroid Research project, that is about a year and two months before its expected perihelion passage. Mattiazzo (2003) reported that C/2002 O7 was disrupted five days after perihelion, and a month later, the comet could no longer be found.
Comet had its closest approach to the Earth on 20 May 2003 (1.709 au), about 4 months before its perihelion passage.
Preffered solution given here is based on pre-perihelion data taken in perihelion distances larger than 2.44 au, that is spanning over 0.753 yr until 30 April 2003. Two NG solutions based on this shorter data-arc match the data equally, and both can be chosen as preferred solutions (dedicated to water ice ('pn') and CO ('p1') sublimation, respectively). Both these NG solutions give very different original 1/a.
See also Sekanina 2019 and Królikowska 2020.
| solution description | ||
|---|---|---|
| number of observations | 1641 | |
| data interval | 2002 07 29 – 2003 07 07 | |
| data type | observed only before perihelion (PRE) | |
| data arc selection | entire data set (STD) | |
| range of heliocentric distances | 5.42 au – 1.58au | |
| type of model of motion | NC - non-gravitational orbits for symmetric CO-g(r)-like function | |
| data weighting | YES | |
| number of residuals | 3247 | |
| RMS [arcseconds] | 0.60 | |
| orbit quality class | 2a | |
| orbital elements (barycentric ecliptic J2000) | ||
|---|---|---|
| Epoch | 1706 03 19 | |
| perihelion date | 2003 09 21.70961328 | ± 0.00134343 |
| perihelion distance [au] | 0.89903313 | ± 0.00000787 |
| eccentricity | 1.00003446 | ± 0.00000512 |
| argument of perihelion [°] | 252.221263 | ± 0.000435 |
| ascending node [°] | 12.912845 | ± 0.000044 |
| inclination [°] | 98.745891 | ± 0.000052 |
| reciprocal semi-major axis [10-6 au-1] | -38.33 | ± 5.69 |
| file containing 5001 VCs swarm |
|---|
| 2002o7c5.bmi |
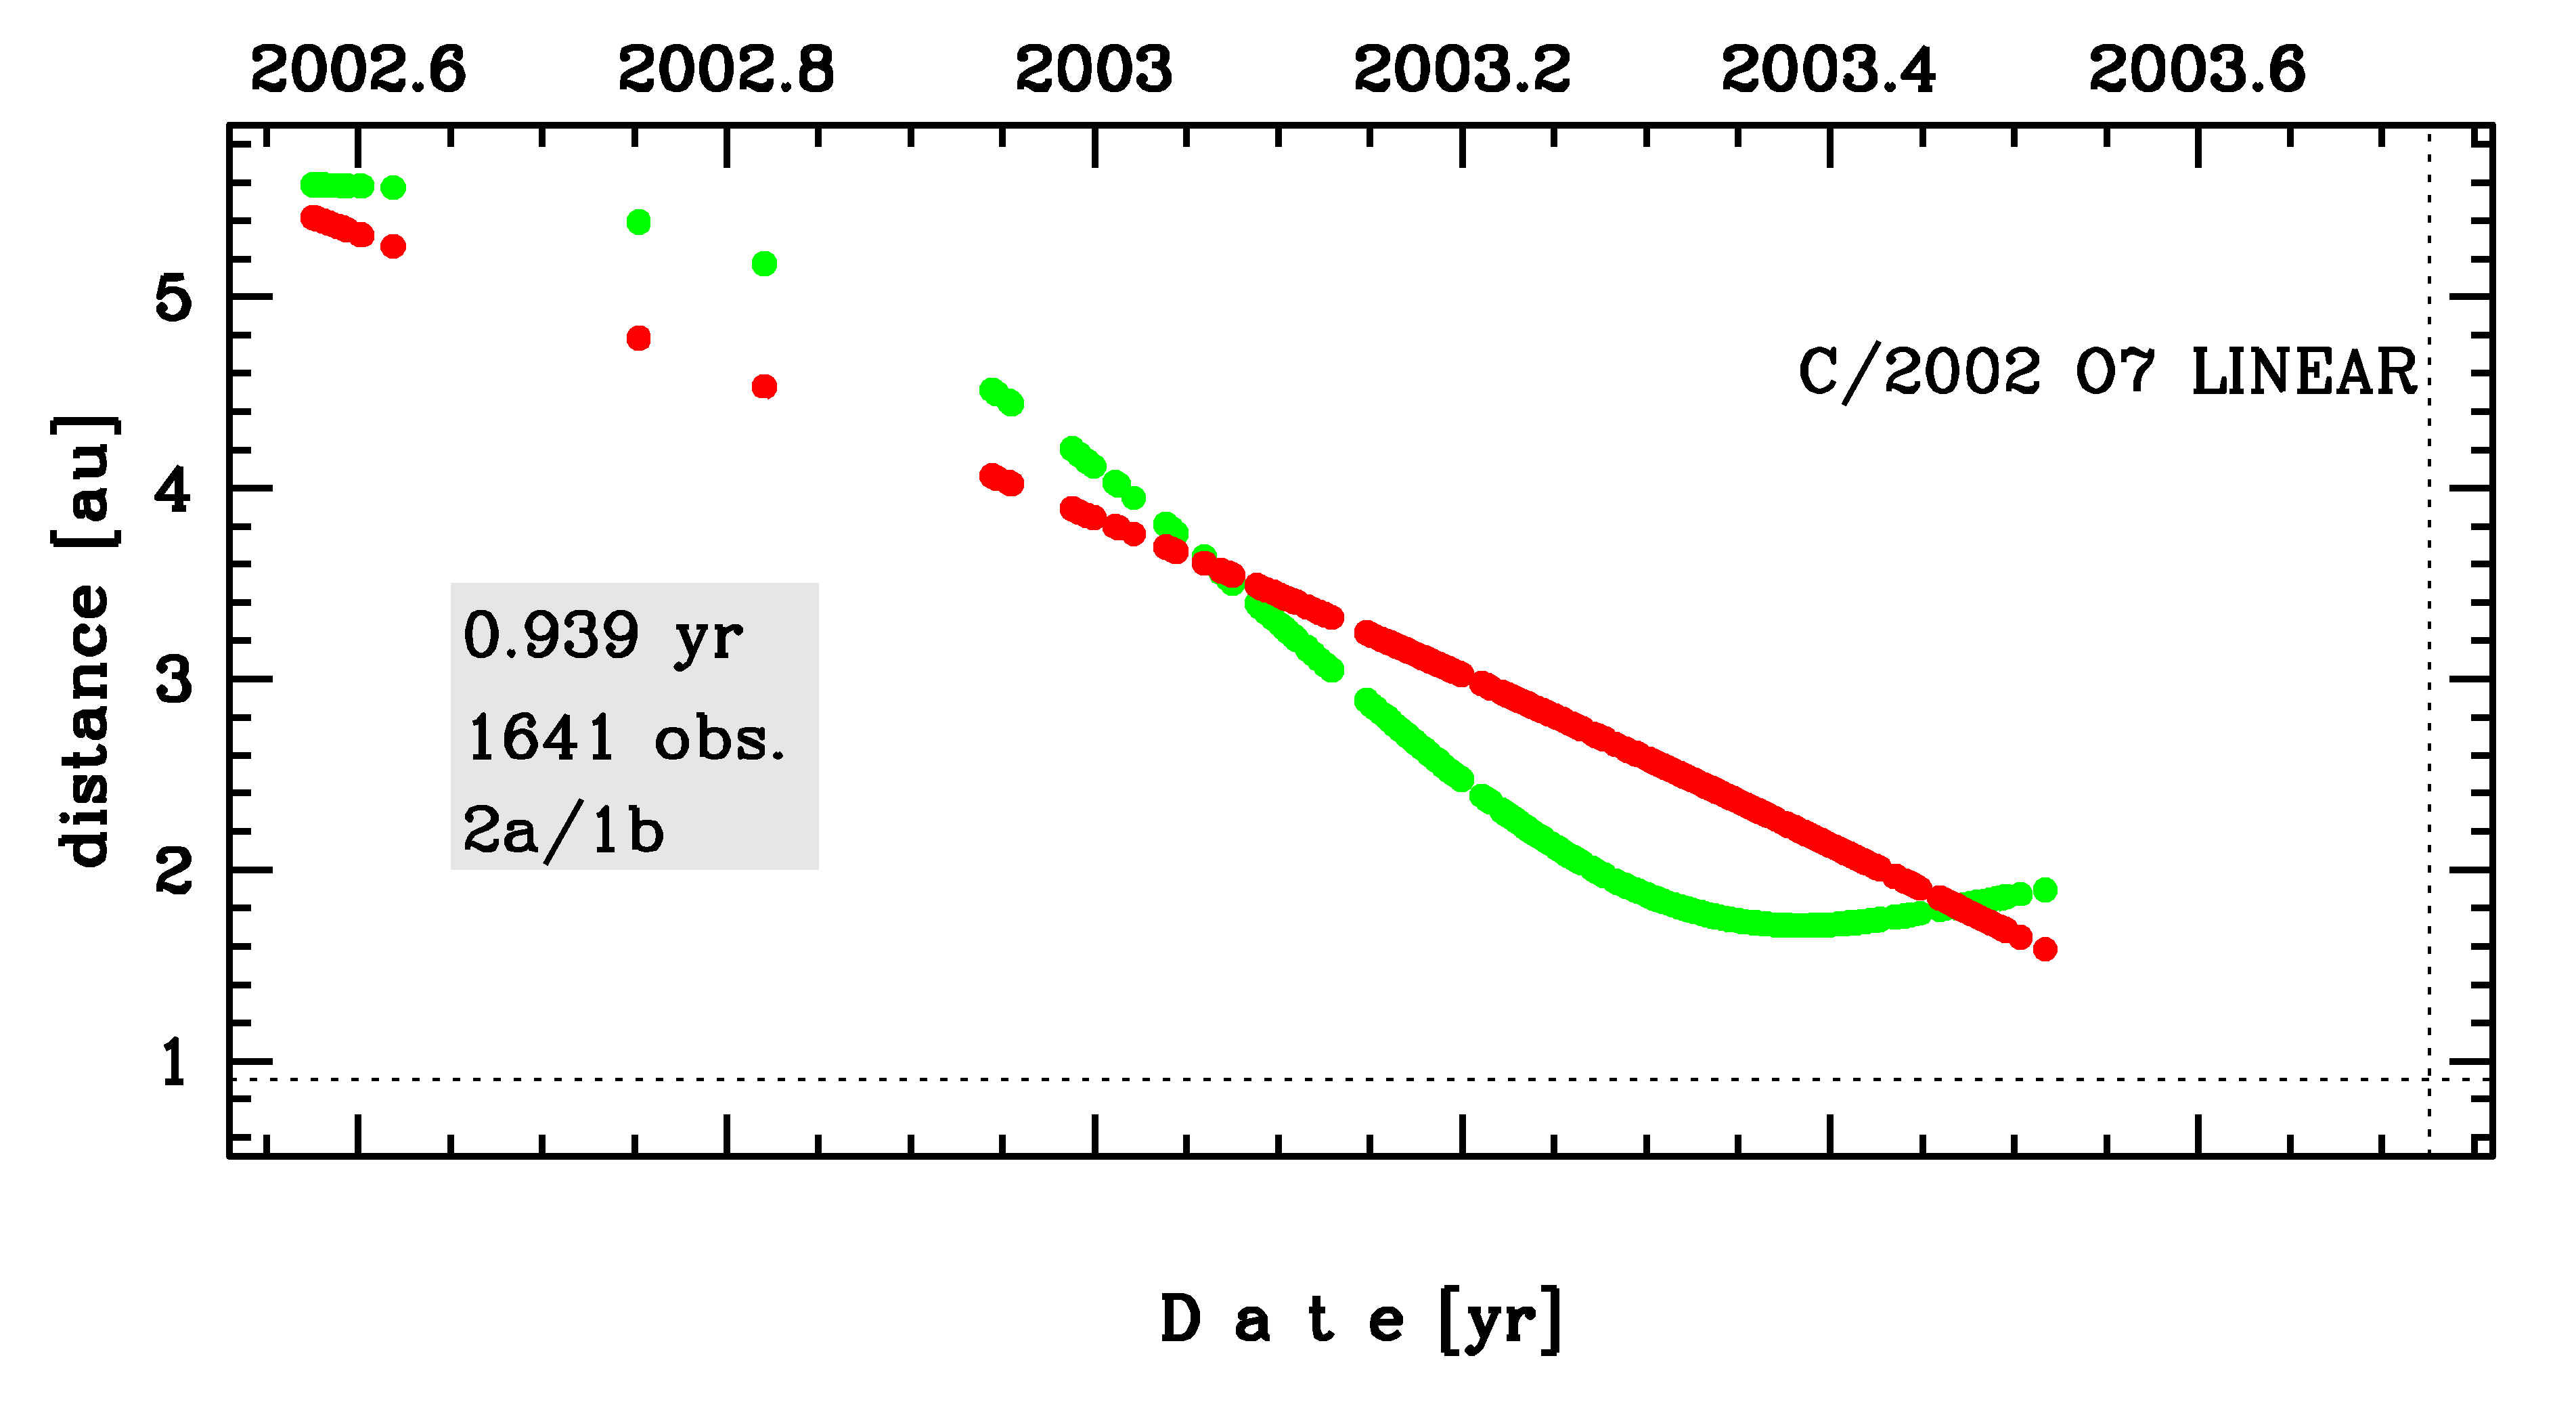
Time distribution of positional observations with corresponding heliocentric (red curve) and geocentric (green curve) distance at which they were taken. The horizontal dotted line shows the perihelion distance for a given comet whereas vertical dotted line — the moment of perihelion passage.
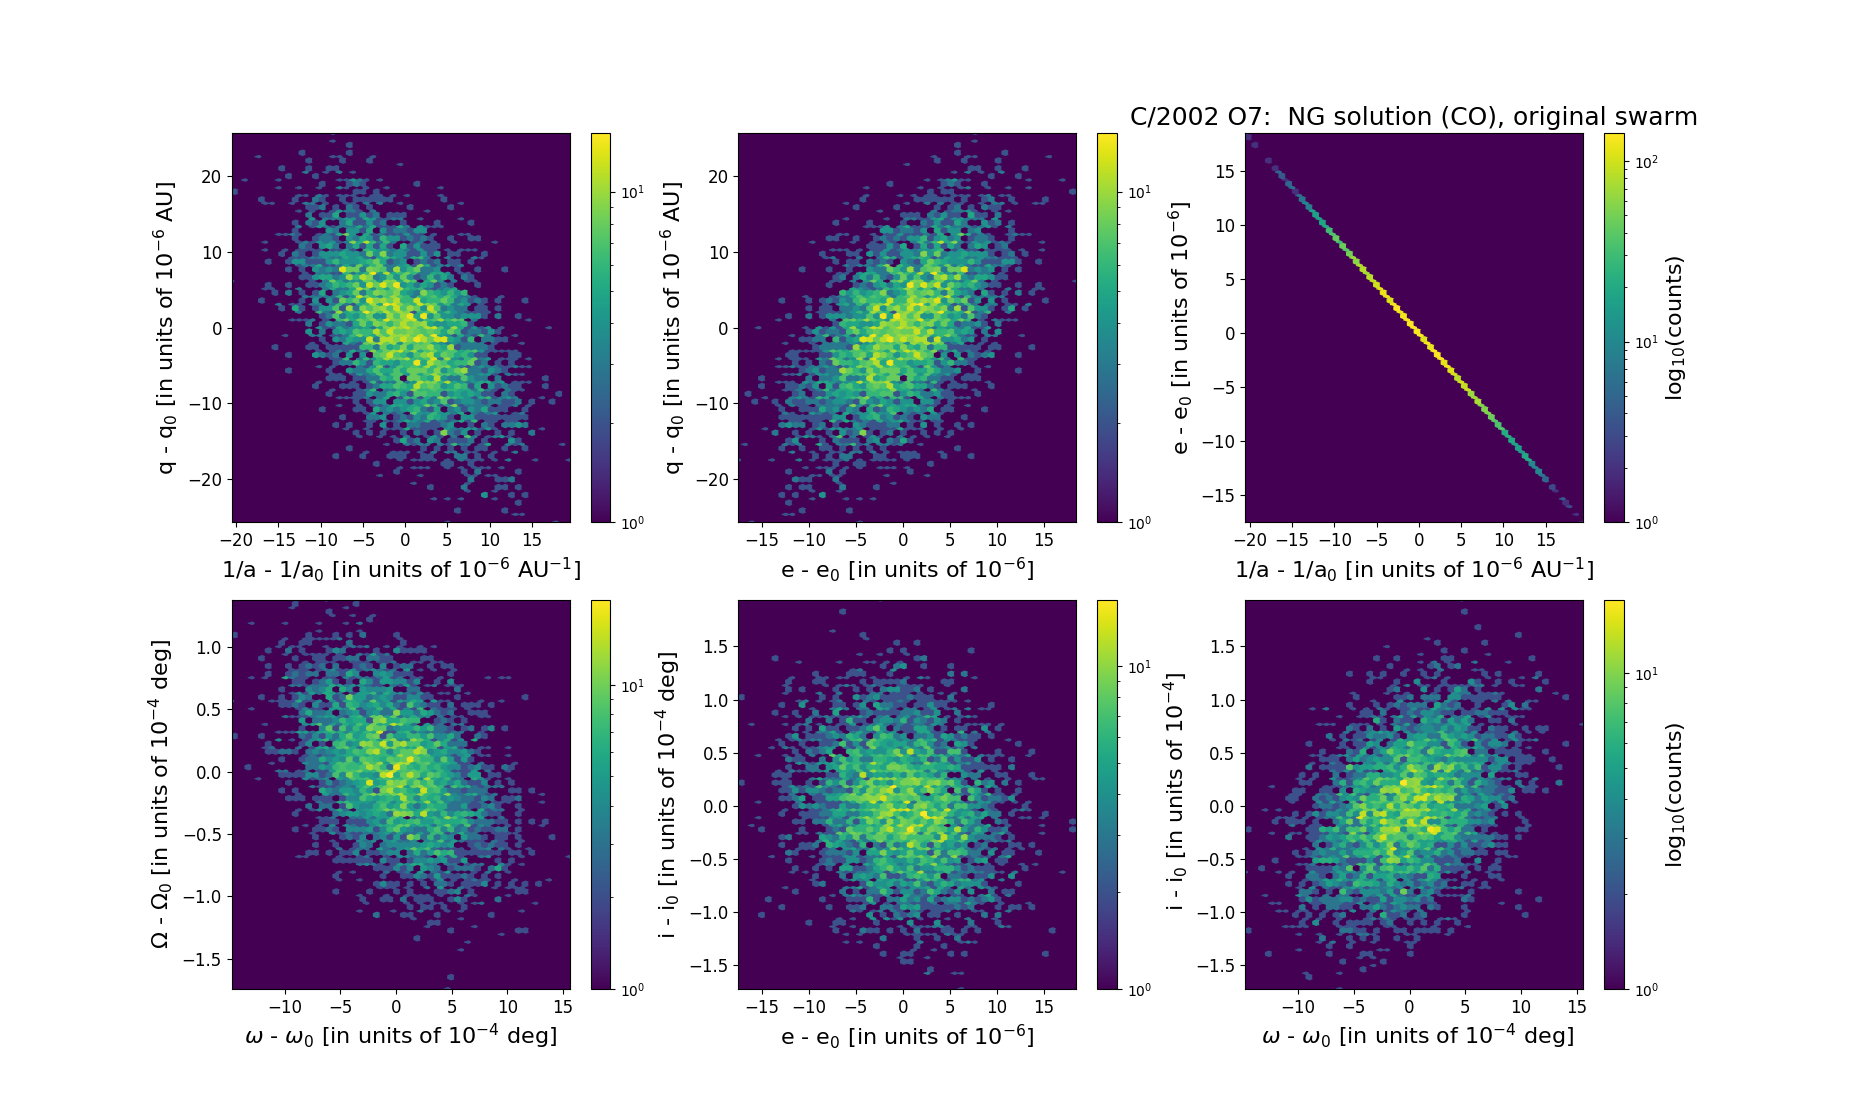
Six 2D-projections of the 6D space of original swarm including 5001 VCs. Each density map is given in logarithmic scale presented on the right in the individual panel.