C/2007 VO53 Spacewatch
more info
An apparently asteroidal object was discovered at Mt. Lemmon on 11 January 2008 and next was identified by T. Spahr with observations made by the Spacewatch survey of an object designated C/2007 VO53. Later, its cometary apperance was reported by several observers [IAUC 8911, 2008 January 18].
This comet made its closest approach to the Earth on 25 November 2009 (4.499 au), five months before perihelion.
Solutions given here are based on data spanning over 4.7 yr in a range of heliocentric distances: 8.31 au – 4.843 au (perihelion) – 7.76 au.
This Oort spike comet suffers slight planetary perturbations during its passage through the planetary system that lead to a more tight future orbit (see future barycentric orbit).
See also Królikowska and Dones 2023, Królikowska and Dybczyński 2017,and Królikowska 2014.
| solution description | ||
|---|---|---|
| number of observations | 417 | |
| data interval | 2010 05 07 – 2012 07 20 | |
| data arc selection | data generally limited to post-perihelion (POS) | |
| range of heliocentric distances | 4.84 au – 7.76au | |
| detectability of NG effects in the comet's motion | NG effects not determinable | |
| type of model of motion | GR - gravitational orbit | |
| data weighting | YES | |
| number of residuals | 807 | |
| RMS [arcseconds] | 0.39 | |
| orbit quality class | 1a+ | |
| next orbit statistics, both Galactic and stellar perturbations were taken into account | ||
|---|---|---|
| no. of returning VCs in the swarm | 5001 | * |
| no. of escaping VCs in the swarm | 0 | |
| no. of hyperbolas among escaping VCs in the swarm | 0 | |
| next reciprocal semi-major axis [10-6 au-1] | 117.90 – 118.97 – 120.10 | |
| next perihelion distance [au] | 4.7317 – 4.7354 – 4.7391 | |
| next aphelion distance [103 au] | 16.65 – 16.81 – 16.96 | |
| time interval to next perihelion [Myr] | 0.759 – 0.77 – 0.78 | |
| percentage of VCs with qnext < 10 | 100 | |
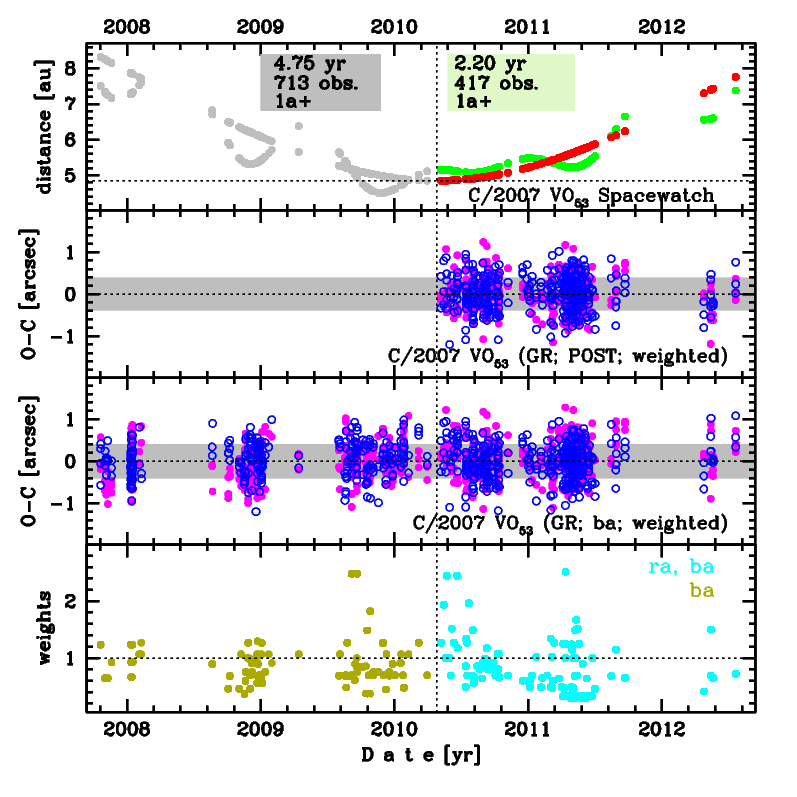
Upper panel: Time distribution of positional observations with corresponding heliocentric (red curve) and geocentric (green curve) distance at which they were taken. The horizontal dotted line shows the perihelion distance for a given comet whereas vertical dotted line — the moment of perihelion passage.
Middle panel(s): O-C diagram for a given solution (sometimes in comparison to another solution available in CODE), where residuals in right ascension are shown using magenta dots and in declination by blue open circles.
Lowest panel: Relative weights for a given data set(s).
Middle panel(s): O-C diagram for a given solution (sometimes in comparison to another solution available in CODE), where residuals in right ascension are shown using magenta dots and in declination by blue open circles.
Lowest panel: Relative weights for a given data set(s).
| next orbit statistics, here only the Galactic tide has been included | ||
|---|---|---|
| no. of returning VCs in the swarm | 5001 | * |
| no. of escaping VCs in the swarm | 0 | |
| no. of hyperbolas among escaping VCs in the swarm | 0 | |
| next reciprocal semi-major axis [10-6 au-1] | 117.88 – 118.96 – 120.08 | |
| next perihelion distance [au] | 4.7313 – 4.7348 – 4.7384 | |
| next aphelion distance [103 au] | 16.65 – 16.81 – 16.96 | |
| time interval to next perihelion [Myr] | 0.759 – 0.77 – 0.78 | |
| percentage of VCs with qnext < 10 | 100 | |