C/2009 F4 McNaught
more info
Comet C/2009 F4 was discovered on 19 March 2009, that is 2.8 yr before perihelion passage, and next was observed 6.4 yr during seven oppositions in a range of heliocentric distances: 8.96 au – 5.455 au (perihelion) – 10.5 au.
Comet had its closest approach to the Earth on 3 June 2011 (5.179 au, almost seven months before perihelion).
NG orbits using full data-arc as well as using pre-perihelion data arc are determinable.
This Oort spike comet suffers a tiny planetary perturbations during its passage through the planetary system that lead to a more tight future orbit (see future barycentric orbit).
See also Królikowska and Dones 2023 and Królikowska and Dybczyński 2017.
| solution description | ||
|---|---|---|
| number of observations | 1213 | |
| data interval | 2009 03 19 – 2015 08 20 | |
| data type | perihelion within the observation arc (FULL) | |
| data arc selection | entire data set (STD) | |
| range of heliocentric distances | 8.96 au – 5.46 au (perihelion) – 10.5 au | |
| detectability of NG effects in the comet's motion | comet with determinable NG~orbit | |
| type of model of motion | GR - gravitational orbit | |
| data weighting | YES | |
| number of residuals | 2396 | |
| RMS [arcseconds] | 0.54 | |
| orbit quality class | 1a+ | |
| next orbit statistics, both Galactic and stellar perturbations were taken into account | ||
|---|---|---|
| no. of returning VCs in the swarm | 5001 | * |
| no. of escaping VCs in the swarm | 0 | |
| no. of hyperbolas among escaping VCs in the swarm | 0 | |
| next reciprocal semi-major axis [10-6 au-1] | 103.40 – 103.77 – 104.15 | |
| next perihelion distance [au] | 5.2155 – 5.2182 – 5.2211 | |
| next aphelion distance [103 au] | 19.2 – 19.27 – 19.34 | |
| time interval to next perihelion [Myr] | 0.9396 – 0.9448 – 0.9498 | |
| percentage of VCs with qnext < 10 | 100 | |
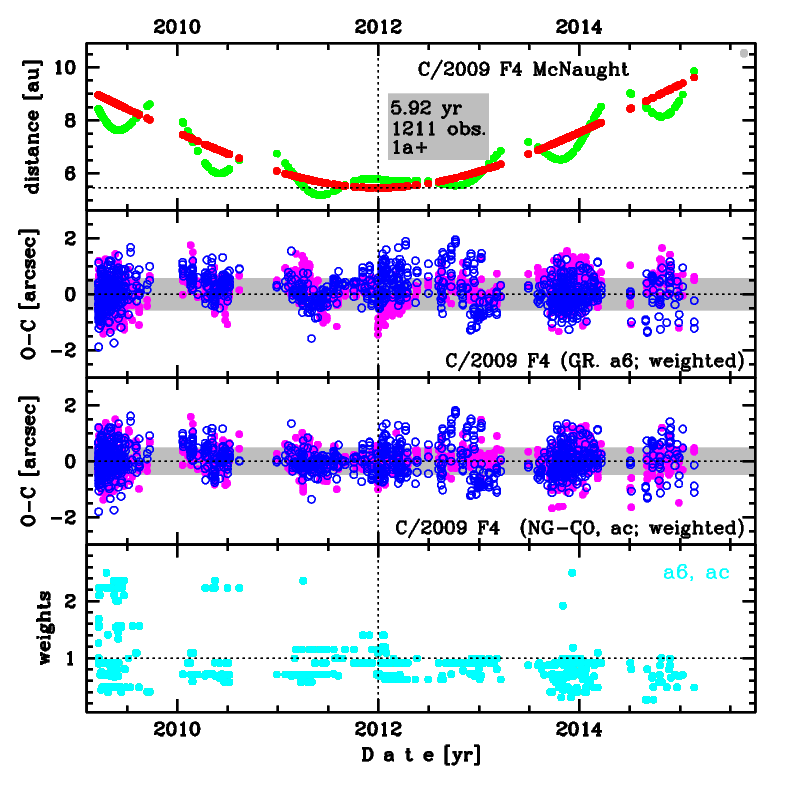
Upper panel: Time distribution of positional observations with corresponding heliocentric (red curve) and geocentric (green curve) distance at which they were taken. The horizontal dotted line shows the perihelion distance for a given comet whereas vertical dotted line — the moment of perihelion passage.
Middle panel(s): O-C diagram for a given solution (sometimes in comparison to another solution available in CODE), where residuals in right ascension are shown using magenta dots and in declination by blue open circles.
Lowest panel: Relative weights for a given data set(s).
Middle panel(s): O-C diagram for a given solution (sometimes in comparison to another solution available in CODE), where residuals in right ascension are shown using magenta dots and in declination by blue open circles.
Lowest panel: Relative weights for a given data set(s).
| next orbit statistics, here only the Galactic tide has been included | ||
|---|---|---|
| no. of returning VCs in the swarm | 5001 | * |
| no. of escaping VCs in the swarm | 0 | |
| no. of hyperbolas among escaping VCs in the swarm | 0 | |
| next reciprocal semi-major axis [10-6 au-1] | 103.39 – 103.76 – 104.14 | |
| next perihelion distance [au] | 5.2125 – 5.2154 – 5.2183 | |
| next aphelion distance [103 au] | 19.2 – 19.27 – 19.34 | |
| time interval to next perihelion [Myr] | 0.9398 – 0.9449 – 0.9499 | |
| percentage of VCs with qnext < 10 | 100 | |