C/2012 F3 PANSTARRS
more info
Comet C/2012 F3 was discovered by the Pan-STARRS 1 telescope (Haleakala) on 16 March 2012 at a distance of 9.57 au from the Sun.A few pre-discovery images were obtained on 19 January 2012 (9.93 au from the Sun) and 2 March 2012. The comet reached its perihelion almost three years later (3.46 au from the Sun, 6 April 2015), and was followed to 17 October 2017 (8.36 au from the Sun).
C/2012 F3 had its closest approach to the Earth on 7 May 2014 (3.649 au, one month after perihelion passage).
NG orbit using full data-arc as well as using pre-perihelion data are determinable.
This Oort spike comet suffered quite large planetary perturbations during its passage through the planetary system that led to escape the comet from the planetary zone on a hyperbolic orbit (see future barycentric orbit).
See also Królikowska and Dones 2023 and Wysoczańska et al., 2020.
| solution description | ||
|---|---|---|
| number of observations | 1747 | |
| data interval | 2012 01 19 – 2017 10 17 | |
| data type | perihelion within the observation arc (FULL) | |
| data arc selection | entire data set (STD) | |
| range of heliocentric distances | 9.93 au – 3.46 au (perihelion) – 8.36 au | |
| type of model of motion | NS - non-gravitational orbits for standard g(r) | |
| data weighting | YES | |
| number of residuals | 3459 | |
| RMS [arcseconds] | 0.34 | |
| orbit quality class | 1a+ | |
| orbital elements (barycentric ecliptic J2000) | ||
|---|---|---|
| Epoch | 2308 12 28 | |
| perihelion date | 2015 04 06.79796992 | ± 0.00016037 |
| perihelion distance [au] | 3.46087510 | ± 0.00000129 |
| eccentricity | 1.00277522 | ± 0.00000188 |
| argument of perihelion [°] | 104.165801 | ± 0.000047 |
| ascending node [°] | 164.546294 | ± 0.000031 |
| inclination [°] | 11.334774 | ± 0.000006 |
| reciprocal semi-major axis [10-6 au-1] | -801.88 | ± 0.54 |
| file containing 5001 VCs swarm |
|---|
| 2012f3l5.bpl |
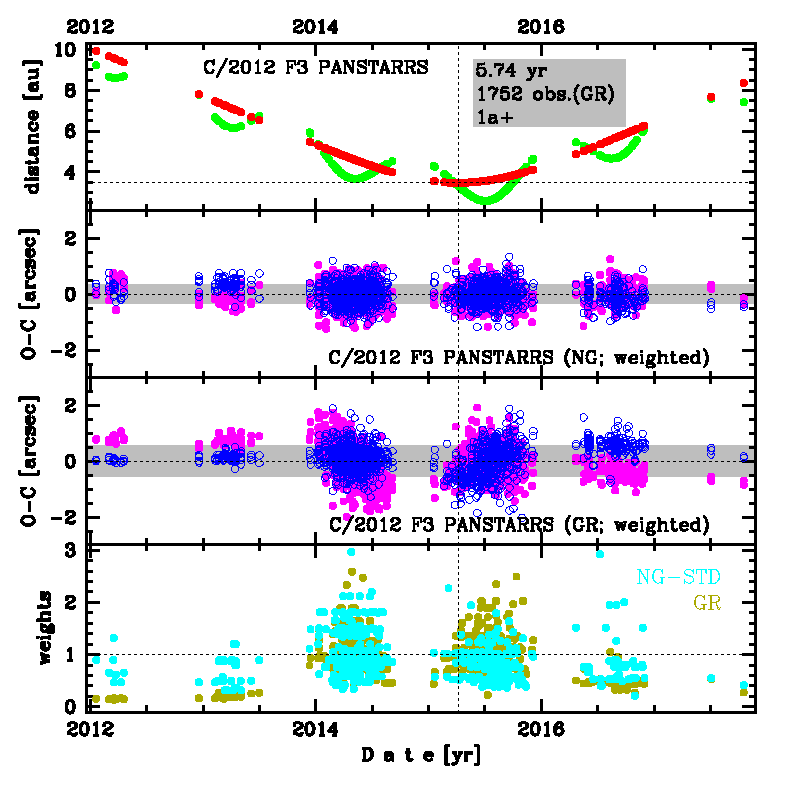
Upper panel: Time distribution of positional observations with corresponding heliocentric (red curve) and geocentric (green curve) distance at which they were taken. The horizontal dotted line shows the perihelion distance for a given comet whereas vertical dotted line — the moment of perihelion passage.
Middle panel(s): O-C diagram for a given solution (sometimes in comparison to another solution available in CODE), where residuals in right ascension are shown using magenta dots and in declination by blue open circles.
Lowest panel: Relative weights for a given data set(s).
Middle panel(s): O-C diagram for a given solution (sometimes in comparison to another solution available in CODE), where residuals in right ascension are shown using magenta dots and in declination by blue open circles.
Lowest panel: Relative weights for a given data set(s).
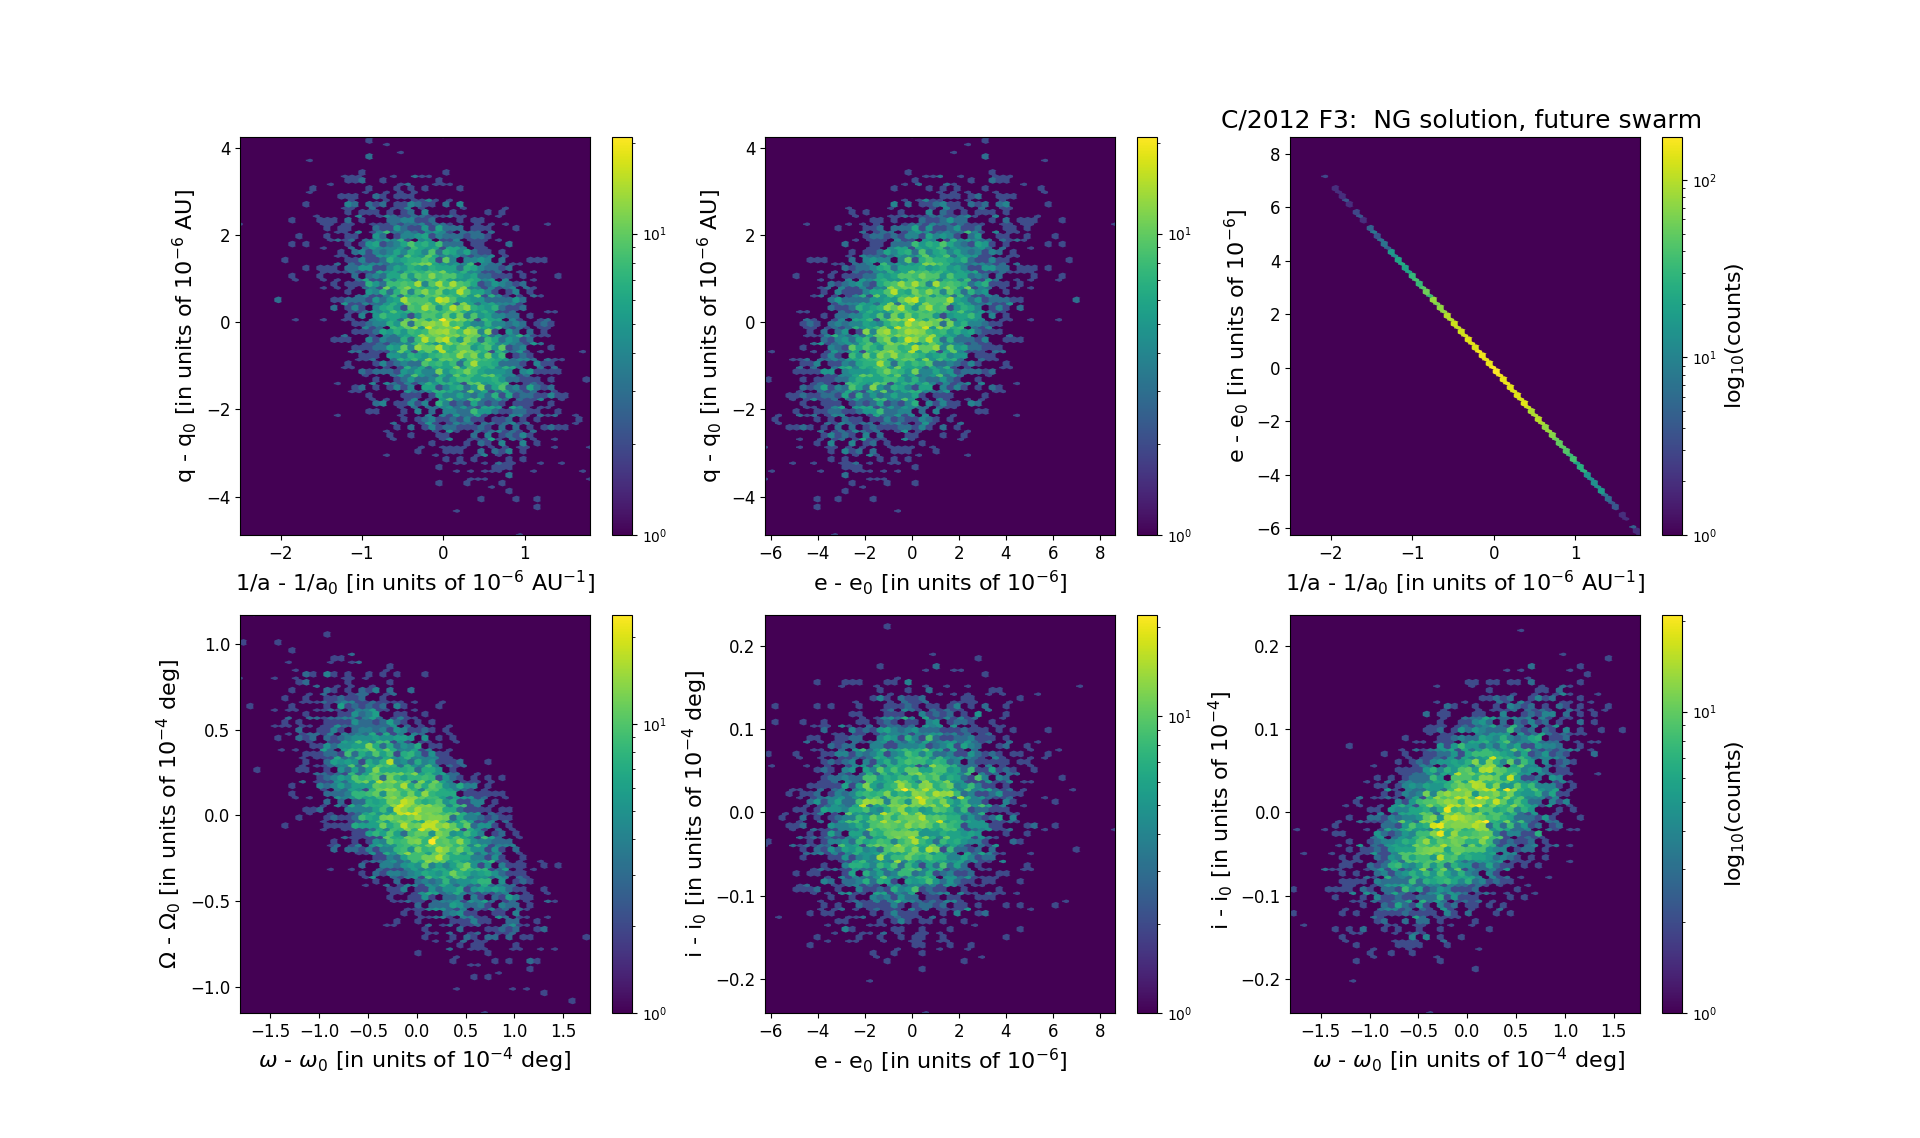
Six 2D-projections of the 6D space of future swarm including 5001 VCs. Each density map is given in logarithmic scale presented on the right in the individual panel.