C/2016 A1 PANSTARRS
more info
Comet C/2016 A1 was discovered on 1 January 2016 with Pan-STARRS 1 telescope (Haleakala), that is about almost 2 yr before its perihelion passage, and was next observed until 15 February 2020.
Comet had its closest approach to the Earth on 17 January 2018 (4.397 au); about 2 months after its perihelion passage.
Solutions given here are based on data spanning over 4.12 yr in a range of heliocentric distances: 7.31 au 5.328 au (perihelion) – 7.90 au.
This Oort spike comet suffers small planetary perturbations during its passage through the planetary system that lead to a more tight future orbit (see future barycentric orbit).
See also Królikowska and Dones 2023.
| solution description | ||
|---|---|---|
| number of observations | 2169 | |
| data interval | 2016 01 01 – 2020 02 15 | |
| data type | perihelion within the observation arc (FULL) | |
| data arc selection | entire data set (STD) | |
| range of heliocentric distances | 7.31 au – 5.33 au (perihelion) – 7.9 au | |
| detectability of NG effects in the comet's motion | NG effects not determinable | |
| type of model of motion | GR - gravitational orbit | |
| data weighting | YES | |
| number of residuals | 4223 | |
| RMS [arcseconds] | 0.38 | |
| orbit quality class | 1a+ | |
| orbital elements (heliocentric ecliptic J2000) | ||
|---|---|---|
| Epoch | 2017 11 23 | |
| perihelion date | 2017 11 23.37344000 | ± 0.00013040 |
| perihelion distance [au] | 5.32775557 | ± 0.00000079 |
| eccentricity | 1.00197687 | ± 0.00000126 |
| argument of perihelion [°] | 10.320446 | ± 0.000013 |
| ascending node [°] | 128.174529 | ± 0.000003 |
| inclination [°] | 121.185707 | ± 0.000004 |
| reciprocal semi-major axis [10-6 au-1] | -371.05 | ± 0.24 |
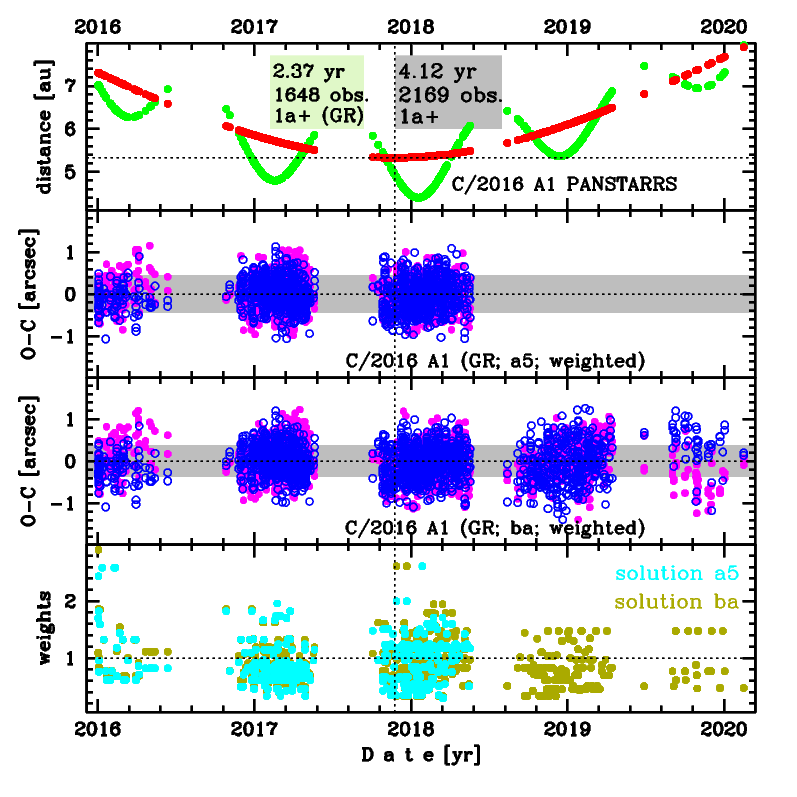
Upper panel: Time distribution of positional observations with corresponding heliocentric (red curve) and geocentric (green curve) distance at which they were taken. The horizontal dotted line shows the perihelion distance for a given comet whereas vertical dotted line — the moment of perihelion passage.
Middle panel(s): O-C diagram for a given solution (sometimes in comparison to another solution available in CODE), where residuals in right ascension are shown using magenta dots and in declination by blue open circles.
Lowest panel: Relative weights for a given data set(s).
Middle panel(s): O-C diagram for a given solution (sometimes in comparison to another solution available in CODE), where residuals in right ascension are shown using magenta dots and in declination by blue open circles.
Lowest panel: Relative weights for a given data set(s).