C/1885 X2 Barnard
more info
C/1885 X2 was discovered on 4 December 1885 by Edward Emerson Barnard (Vanderbilt University Observatory, Nashville, Tennessee, USA), that is about 5 months before its perihelion passage, and it was last seen on 26 July 1886 [Kronk, Cometography: Volume 2].
This comet made its closest approach to the Earth on 27 May 1886 (0.335 au), that is 3.5 weeks after perihelion passage.
Solutions given here are based on data spanning over 0.64 yr in a range of heliocentric distances from 2.72 au through perihelion (0.479 au) to 1.76 au.
This Oort spike comet suffers rather small planetary perturbations during its passage through the planetary system; these perturbations lead to less tight future orbit (see future barycentric orbit for preferred solution).
C/1885 X2 was in the original sample of 19 comets used by Oort for his hypothesis on LPCs; however, according to presented here statistics for previous perihelion passage this comet is dynamically old.
See also Królikowska 2020.
| solution description | ||
|---|---|---|
| number of observations | 677 | |
| data interval | 1885 12 04 – 1886 07 26 | |
| data type | perihelion within the observation arc (FULL) | |
| data arc selection | entire data set (STD) | |
| range of heliocentric distances | 2.72 au – 0.48 au (perihelion) – 1.76 au | |
| type of model of motion | NS - non-gravitational orbits for standard g(r) | |
| data weighting | YES | |
| number of residuals | 1134 | |
| RMS [arcseconds] | 4.10 | |
| orbit quality class | 2a | |
| next orbit statistics, both Galactic and stellar perturbations were taken into account | ||
|---|---|---|
| no. of returning VCs in the swarm | 4978 | * |
| no. of escaping VCs in the swarm | 23 | |
| no. of hyperbolas among escaping VCs in the swarm | 7 | |
| next reciprocal semi-major axis [10-6 au-1] | 60.84 – 106.23 – 154.74 | R |
| next perihelion distance [au] | 0.485 – 0.503 – 28.6 | R |
| next aphelion distance [103 au] | 13 – 19 – 33 | R |
| time interval to next perihelion [Myr] | 0.52 – 0.91 – 2.1 | R |
| percentage of VCs with qnext < 10 | 82 | |
| percentage of VCs with 10 < qnext < 20 | 5 | |
| percentage of VCs with qnext > 20 | 13 | |
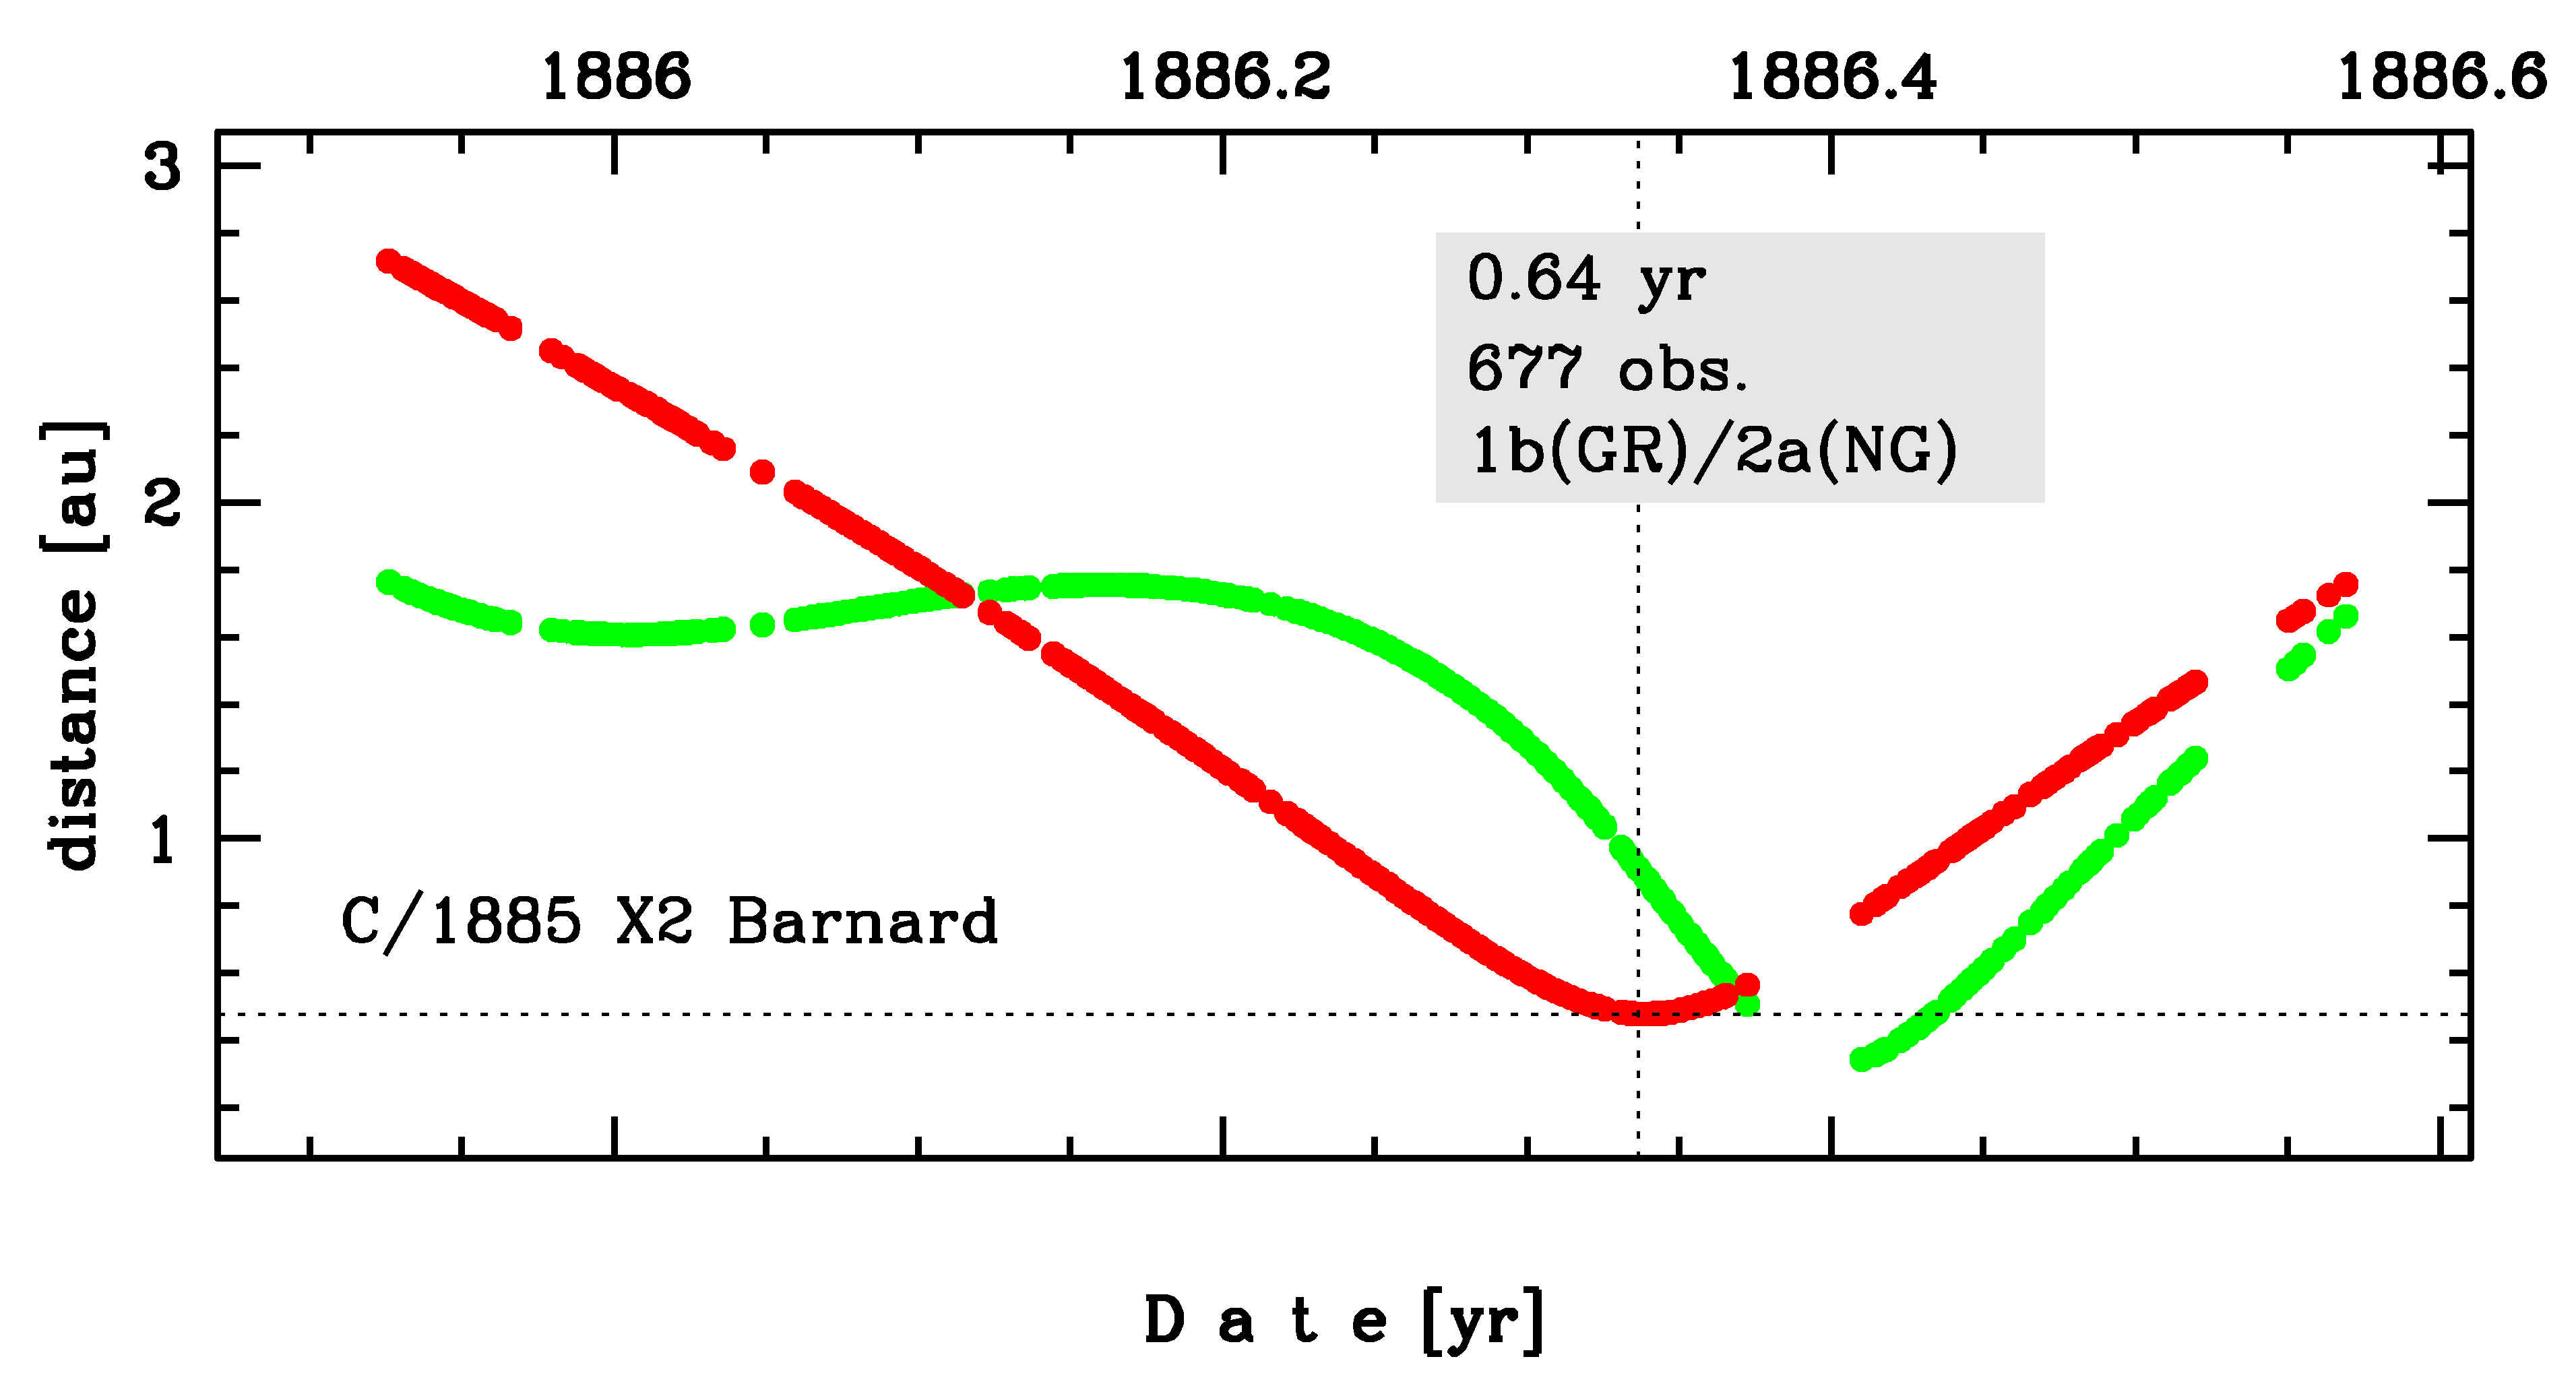
Time distribution of positional observations with corresponding heliocentric (red curve) and geocentric (green curve) distance at which they were taken. The horizontal dotted line shows the perihelion distance for a given comet whereas vertical dotted line — the moment of perihelion passage.
| next_g orbit statistics, here only the Galactic tide has been included | ||
|---|---|---|
| no. of returning VCs in the swarm | 4977 | * |
| no. of escaping VCs in the swarm | 24 | |
| no. of hyperbolas among escaping VCs in the swarm | 7 | |
| next reciprocal semi-major axis [10-6 au-1] | 61.16 – 106.23 – 154.75 | R |
| next perihelion distance [au] | 0.485 – 0.504 – 0.789 | R |
| next aphelion distance [103 au] | 13 – 19 – 33 | R |
| time interval to next perihelion [Myr] | 0.52 – 0.91 – 2.1 | R |
| percentage of VCs with qnext < 10 | 98 | |
| percentage of VCs with qnext > 20 | 2 | |