C/1913 Y1 Delavan
more info
Comet C/1913 Y1 was discovered on 18 December 1913 by Paulnbsp;T.nbsp;Delavan (La Plata Observatory, Argentina), that is about ten months before its perihelion passage, and the comet was last seen on 19 September 1915 [Kronk, Cometography: Volume 3].
This comet made its closest approach to the Earth on 4 October 1914 (1.58 au), that is 9.5 months after its discovery.
Solutions given here are based on data spanning over 1.72 yr in a range of heliocentric distances from 4.24 au through perihelion (1.10 au) to 4.26 au.
Pure gravitational orbit determined from all available positional measurements (1006 observations) give 1a-class orbit, orbit given in Minor Planet Center is 1B class (339 obs. used, the same arc of data; see MPC).
It was possible to determine the non-gravitational orbit for C/1913 Y1 (preferred orbit), the decrease of RMS is small (from 2.06 arcsec to 2.00 arcs) though only radial non-gravitational parameter was determined.
This Oort spike comet suffers very slight planetary perturbations during its passage through the planetary system, and in the next passage through the perihelion it will enter the planet zone as Oort spike comet (see future barycentric orbits for both solutions: pure gravitational and non-gravitational).
This comet was in the original sample of 19 comets used by Oort for his hypothesis on LPCs; however, according to presented here statistics for previous perihelion passage its dynamical status is uncertain.
More details in Królikowska et al. 2014.
| solution description | ||
|---|---|---|
| number of observations | 1006 | |
| data interval | 1913 12 18 – 1915 09 07 | |
| data type | perihelion within the observation arc (FULL) | |
| data arc selection | entire data set (STD) | |
| range of heliocentric distances | 4.24 au – 1.10 au (perihelion) – 4.26 au | |
| type of model of motion | NS - non-gravitational orbits for standard g(r) | |
| data weighting | YES | |
| number of residuals | 1860 | |
| RMS [arcseconds] | 2.00 | |
| orbit quality class | 1b | |
| previous orbit statistics, both Galactic and stellar perturbations were taken into account | ||
|---|---|---|
| no. of returning VCs in the swarm | 5001 | * |
| no. of escaping VCs in the swarm | 0 | |
| no. of hyperbolas among escaping VCs in the swarm | 0 | |
| previous reciprocal semi-major axis [10-6 au-1] | 29.46 – 39.69 – 58.48 | |
| previous perihelion distance [au] | 2.4 – 59 – 190 | |
| previous aphelion distance [103 au] | 34 – 50 – 63 | |
| time interval to previous perihelion [Myr] | 2.3 – 2.6 – 3 | |
| percentage of VCs with qprev < 10 | 34 | |
| percentage of VCs with qprev > 20 | 66 | |
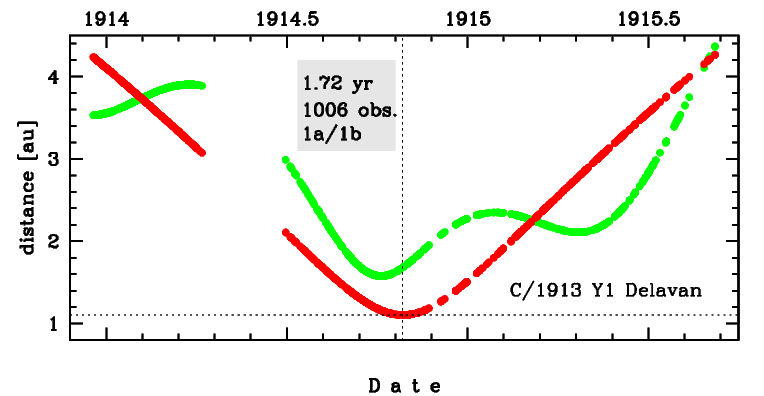
Time distribution of positional observations with corresponding heliocentric (red curve) and geocentric (green curve) distance at which they were taken. The horizontal dotted line shows the perihelion distance for a given comet whereas vertical dotted line — the moment of perihelion passage.
| previous_g orbit statistics, here only the Galactic tide has been included | ||
|---|---|---|
| no. of returning VCs in the swarm | 5001 | * |
| no. of escaping VCs in the swarm | 0 | |
| no. of hyperbolas among escaping VCs in the swarm | 0 | |
| previous reciprocal semi-major axis [10-6 au-1] | 47.02 – 52.57 – 57.93 | |
| previous perihelion distance [au] | 1.9 – 2.3 – 3.2 | |
| previous aphelion distance [103 au] | 34.5 – 38 – 42.5 | |
| time interval to previous perihelion [Myr] | 2.3 – 2.6 – 3.1 | |
| percentage of VCs with qprev < 10 | 100 | |