C/1919 Q2 Metcalf
more info
Comet C/1919 Q2 was discovered on 23 August 1919 by Joel Hastings Metcalf (Camp Idlewild, South Hero, Vermont, USA), that is about 3.5 months before its perihelion passage, and the comet was last seen on 17 February 1920 [Kronk, Cometography: Volume 3].
This comet made its closest approach to the Earth on 29 November 1919 (1.90 au), that is eight days before its perihelion passage.
Solution given here is based on data spanning over 0.444 yr in a range of heliocentric distances from 1.951 au through perihelion (1.115 au) to 1.446 au.
This Oort spike comet suffers very slight planetary perturbations during its passage through the planetary system; however, they lead to escape the comet from the planetary zone on a hyperbolic orbit (see future barycentric orbit).
More details in Królikowska et al. 2014.
| solution description | ||
|---|---|---|
| number of observations | 276 | |
| data interval | 1919 08 25 – 1920 02 03 | |
| data type | perihelion within the observation arc (FULL) | |
| data arc selection | entire data set (STD) | |
| range of heliocentric distances | 1.95 au – 1.11 au (perihelion) – 1.75 au | |
| detectability of NG effects in the comet's motion | NG effects not determinable | |
| type of model of motion | GR - gravitational orbit | |
| data weighting | YES | |
| number of residuals | 498 | |
| RMS [arcseconds] | 2.58 | |
| orbit quality class | 2a | |
| previous orbit statistics, both Galactic and stellar perturbations were taken into account | ||
|---|---|---|
| no. of returning VCs in the swarm | 2954 | * |
| no. of escaping VCs in the swarm | 2047 | |
| no. of hyperbolas among escaping VCs in the swarm | 1534 | |
| previous reciprocal semi-major axis [10-6 au-1] | -52.40 – 31.82 – 118.69 | |
| previous perihelion distance [au] | 1.2 – 1.9 – 670 | R |
| previous aphelion distance [103 au] | 15 – 34 – 160 | |
| time interval to previous perihelion [Myr] | 0.62 – 1.7 – 7.7 | R |
| percentage of VCs with qprev < 10 | 64 | |
| percentage of VCs with 10 < qprev < 20 | 1 | |
| percentage of VCs with qprev > 20 | 35 | |
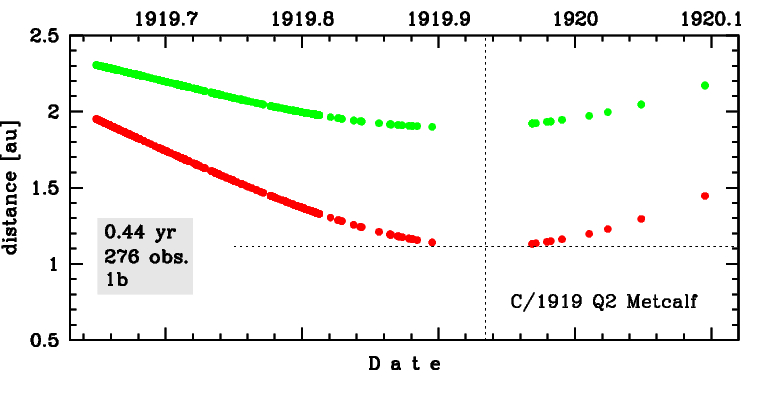
Time distribution of positional observations with corresponding heliocentric (red curve) and geocentric (green curve) distance at which they were taken. The horizontal dotted line shows the perihelion distance for a given comet whereas vertical dotted line — the moment of perihelion passage.
| previous_g orbit statistics, here only the Galactic tide has been included | ||
|---|---|---|
| no. of returning VCs in the swarm | 2985 | * |
| no. of escaping VCs in the swarm | 2016 | |
| no. of hyperbolas among escaping VCs in the swarm | 1534 | |
| previous reciprocal semi-major axis [10-6 au-1] | -52.26 – 31.86 – 118.70 | |
| previous perihelion distance [au] | 1.2 – 1.8 – 120 | R |
| previous aphelion distance [103 au] | 15 – 34 – 160 | |
| time interval to previous perihelion [Myr] | 0.62 – 1.8 – 7.7 | R |
| percentage of VCs with qprev < 10 | 76 | |
| percentage of VCs with 10 < qprev < 20 | 5 | |
| percentage of VCs with qprev > 20 | 19 | |