C/1925 W1 Van Biesbroeck
more info
Comet C/1925 W1 was discovered on 17 November 1925 by George Van Biesbroeck (Yerkes Observatory, Wisconsin, USA), that is 1.5 month after perihelion passage, and the comet was last seen on 10 June 1926 [Kronk, Cometography: Volume 3].
This comet made its closest approach to the Earth on 29 January 1926 (1.351 au), that is 2.3 months after its discovery.
Solution given here is based on data spanning over 0.562 yr in a range of heliocentric distances from 1.69 au to 3.48 au.
This Oort spike comet suffers moderate planetary perturbations during its passage through the planetary system that lead to escape the comet from the planetary zone on a hyperbolic orbit (see future barycentric orbit given here).
This comet was in the original sample of 19 comets used by Oort for his hypothesis on LPCs, and according to presented here statistics for previous perihelion passage this comet most probably is dynamically new.
More details in Królikowska et al. 2014.
| solution description | ||
|---|---|---|
| number of observations | 342 | |
| data interval | 1925 11 17 – 1926 06 10 | |
| data type | observed only after perihelion (POST) | |
| data arc selection | entire data set (STD) | |
| range of heliocentric distances | 1.57 au – 3.47au | |
| detectability of NG effects in the comet's motion | NG effects not determinable | |
| type of model of motion | GR - gravitational orbit | |
| data weighting | YES | |
| number of residuals | 593 | |
| RMS [arcseconds] | 1.94 | |
| orbit quality class | 1b | |
| previous orbit statistics, both Galactic and stellar perturbations were taken into account | ||
|---|---|---|
| no. of returning VCs in the swarm | 4602 | * |
| no. of escaping VCs in the swarm | 399 | |
| no. of hyperbolas among escaping VCs in the swarm | 2 | |
| previous reciprocal semi-major axis [10-6 au-1] | 20.11 – 29.49 – 39.08 | R |
| previous perihelion distance [au] | 1200 – 2200 – 3800 | R |
| previous aphelion distance [103 au] | 50 – 66 – 96 | R |
| time interval to previous perihelion [Myr] | 3.8 – 5.9 – 11 | R |
| percentage of VCs with qprev > 20 | 100 | |
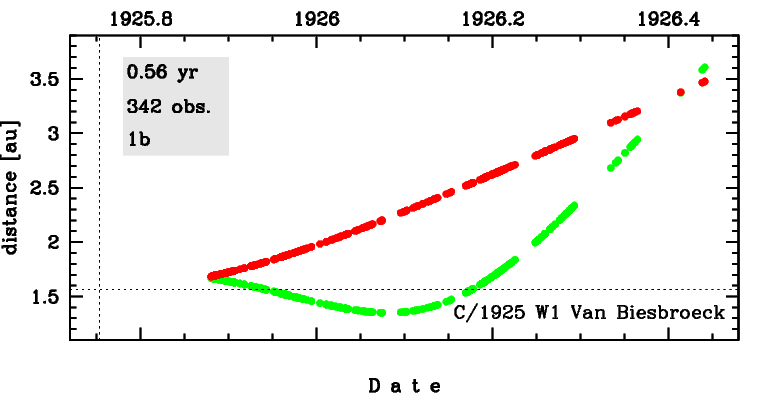
Time distribution of positional observations with corresponding heliocentric (red curve) and geocentric (green curve) distance at which they were taken. The horizontal dotted line shows the perihelion distance for a given comet whereas vertical dotted line — the moment of perihelion passage.
| previous_g orbit statistics, here only the Galactic tide has been included | ||
|---|---|---|
| no. of returning VCs in the swarm | 4466 | * |
| no. of escaping VCs in the swarm | 535 | |
| no. of hyperbolas among escaping VCs in the swarm | 4 | |
| previous reciprocal semi-major axis [10-6 au-1] | 20.06 – 29.91 – 41.27 | R |
| previous perihelion distance [au] | 5 – 23 – 240 | R |
| previous aphelion distance [103 au] | 48 – 67 – 99 | R |
| time interval to previous perihelion [Myr] | 3.8 – 6.1 – 11 | R |
| percentage of VCs with qprev < 10 | 28 | |
| percentage of VCs with 10 < qprev < 20 | 19 | |
| percentage of VCs with qprev > 20 | 53 | |