C/1940 R2 Cunningham
more info
Comet C/1940 R2 was discovered on 5 September 1940 by r Leland Cunningham (Oak Ridge Station of Harvard College Observatory, Massachusetts, USA), that is about 4.3 months before its perihelion passage, and the comet was last seen on 17 June 1941 [Kronk, Cometography: Volume 4]. Soon after, a prediscovery images on plates exposed on 25 August were found.
This comet made its closest approach to the Earth on 10 January 1941 (0.595 au), that is 6 days before perihelion passage.
Solutions given here are based on data spanning over 0.600 yr in a range of heliocentric distances from 2.706 au through perihelion (0.368 au) to 1.665 au.
Pure gravitational orbit determined from all available positional measurements (370 observations) give 1b-class orbit similarly as in Minor Planet Center (189 obs. used, arc of data longer about 1.5 months; 1B-class, see MPC), however, solution presented here give hyperbolic original orbit.
It was possible to determine the non-gravitational orbit for C/1940 R2 (preferred orbit) where a significant decrease of RMS was obtained (from 1.77 to 1.44 arcsec), and original semimajor axis placed this comet within the Oort spike in this NG model.
This Oort spike comet suffers large planetary perturbations during its passage through the planetary system, and they led to escape the comet from the planetary zone on a hyperbolic orbit (see future barycentric orbits in both solutions).
More details in Królikowska et al. 2014.
| solution description | ||
|---|---|---|
| number of observations | 370 | |
| data interval | 1940 08 25 – 1941 04 01 | |
| data type | perihelion within the observation arc (FULL) | |
| data arc selection | entire data set (STD) | |
| range of heliocentric distances | 2.71 au – 0.37 au (perihelion) – 1.67 au | |
| type of model of motion | NS - non-gravitational orbits for standard g(r) | |
| data weighting | YES | |
| number of residuals | 670 | |
| RMS [arcseconds] | 1.49 | |
| orbit quality class | 2a | |
| previous orbit statistics, both Galactic and stellar perturbations were taken into account | ||
|---|---|---|
| no. of returning VCs in the swarm | 4906 | * |
| no. of escaping VCs in the swarm | 95 | |
| no. of hyperbolas among escaping VCs in the swarm | 2 | |
| previous reciprocal semi-major axis [10-6 au-1] | 30.15 – 46.92 – 73.97 | R |
| previous perihelion distance [au] | 0.63 – 120 – 1900 | R |
| previous aphelion distance [103 au] | 27 – 42 – 64 | R |
| time interval to previous perihelion [Myr] | 1.6 – 2.7 – 5.7 | R |
| percentage of VCs with qprev < 10 | 45 | |
| percentage of VCs with 10 < qprev < 20 | 1 | |
| percentage of VCs with qprev > 20 | 54 | |
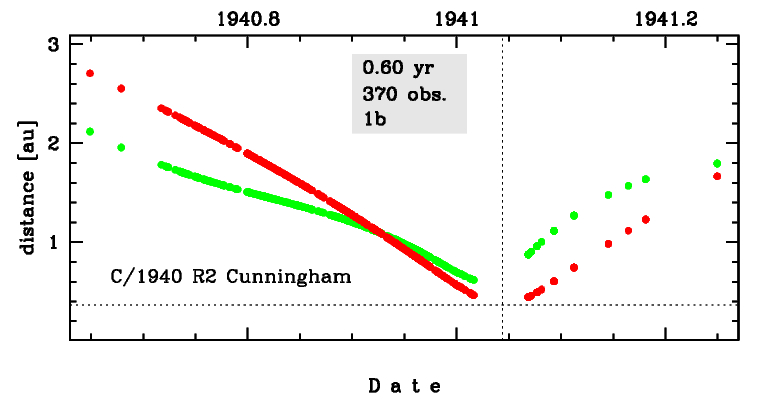
Time distribution of positional observations with corresponding heliocentric (red curve) and geocentric (green curve) distance at which they were taken. The horizontal dotted line shows the perihelion distance for a given comet whereas vertical dotted line — the moment of perihelion passage.
| previous_g orbit statistics, here only the Galactic tide has been included | ||
|---|---|---|
| no. of returning VCs in the swarm | 4903 | * |
| no. of escaping VCs in the swarm | 98 | |
| no. of hyperbolas among escaping VCs in the swarm | 3 | |
| previous reciprocal semi-major axis [10-6 au-1] | 31.26 – 51.96 – 73.99 | R |
| previous perihelion distance [au] | 0.47 – 1.1 – 17 | R |
| previous aphelion distance [103 au] | 27 – 38 – 64 | R |
| time interval to previous perihelion [Myr] | 1.6 – 2.7 – 5.7 | R |
| percentage of VCs with qprev < 10 | 86 | |
| percentage of VCs with 10 < qprev < 20 | 5 | |
| percentage of VCs with qprev > 20 | 9 | |