C/1946 U1 Bester
more info
Comet C/1946 U1 was discovered on 31 October 1946 by Michiel J. Bester (Boyden Station of Harvard College Observatory, Bloemfontein, South Africa), that is over three months before perihelion passage, and the comet was last seen on 2 October 1948. [Kronk, Cometography: Volume 4].
This comet made its closest approach to the Earth on 29 November 1946 (1.864 au), that is about one month after its discovery.
Solutions given here are based on data spanning over 1.918 yr in a range of heliocentric distances from 2.631 au through perihelion (2.408 au) to 6.316 au.
Pure gravitational orbit determined from all available positional measurements (141 observations) give slightly hyperbolic original barycentric orbit (1a-class orbit); also original orbit given in Minor Planet Center is slightly hyperbolic (97 obs. used, the same arc of data; 1A-class orbit, see MPC).
It was possible to determine the non-gravitational orbits for C/1946 U1 where a small decreases of RMS were obtained. Both these NG-solutions give elliptical original orbit (see original barycentric orbits).
This probably Oort spike comet suffers slight (GR and preferred NG solutions) or small (NG solution: n5) planetary perturbations during its passage through the planetary system. According to both solutions, however, it will enter the planet zone as Oort spike comet in the next perihelion passage (see future barycentric orbits).
More details in Królikowska et al. 2014.
| solution description | ||
|---|---|---|
| number of observations | 141 | |
| data interval | 1946 11 02 – 1948 10 02 | |
| data type | perihelion within the observation arc (FULL) | |
| data arc selection | entire data set (STD) | |
| range of heliocentric distances | 2.64 au – 2.41 au (perihelion) – 6.32 au | |
| type of model of motion | NS - non-gravitational orbits for standard g(r) | |
| data weighting | YES | |
| number of residuals | 259 | |
| RMS [arcseconds] | 1.20 | |
| orbit quality class | 1b | |
| next orbit statistics, both Galactic and stellar perturbations were taken into account | ||
|---|---|---|
| no. of returning VCs in the swarm | 5001 | * |
| no. of escaping VCs in the swarm | 0 | |
| no. of hyperbolas among escaping VCs in the swarm | 0 | |
| next reciprocal semi-major axis [10-6 au-1] | 36.52 – 44.34 – 52.12 | |
| next perihelion distance [au] | 27 – 37 – 56 | |
| next aphelion distance [103 au] | 38 – 45 – 55 | |
| time interval to next perihelion [Myr] | 2.6 – 3.3 – 4.4 | |
| percentage of VCs with qnext > 20 | 100 | |
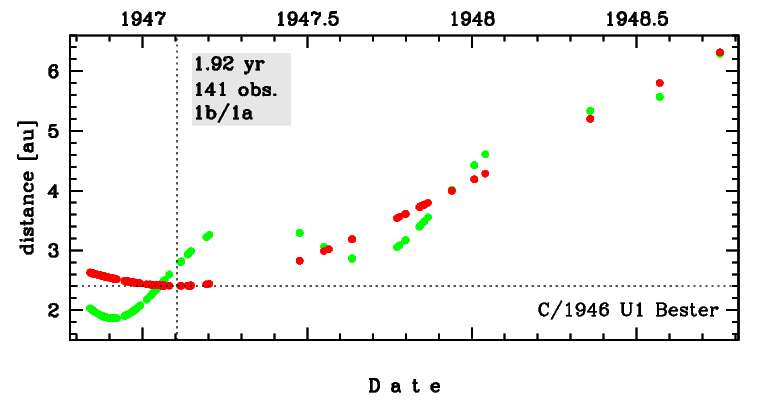
Time distribution of positional observations with corresponding heliocentric (red curve) and geocentric (green curve) distance at which they were taken. The horizontal dotted line shows the perihelion distance for a given comet whereas vertical dotted line — the moment of perihelion passage.
| next_g orbit statistics, here only the Galactic tide has been included | ||
|---|---|---|
| no. of returning VCs in the swarm | 5001 | * |
| no. of escaping VCs in the swarm | 0 | |
| no. of hyperbolas among escaping VCs in the swarm | 0 | |
| next reciprocal semi-major axis [10-6 au-1] | 35.43 – 43.69 – 52.15 | |
| next perihelion distance [au] | 3.8 – 6.2 – 16 | |
| next aphelion distance [103 au] | 38 – 46 – 56 | |
| time interval to next perihelion [Myr] | 2.6 – 3.4 – 4.7 | |
| percentage of VCs with qnext < 10 | 77 | |
| percentage of VCs with 10 < qnext < 20 | 16 | |
| percentage of VCs with qnext > 20 | 7 | |