C/1954 Y1 Haro-Chavira
more info
Comet C/1954 Y1 was discovered on 18 December 1954, about one year before perihelion passage, and was last seen on 15 May 1958 [Kronk, Cometography: Volume 4].
The comet made its closest approach to the Earth on 9 December 1955 (3.51 au), almost seven weeks before perihelion passage.
Solution given here is based on data spanning over 3.3 yr in a range of heliocentric distances: 5.16 au – 4.08 au (perihelion) – 7.79 au.
This Oort spike comet suffers small planetary perturbations during its passage through the planetary system that lead to escape the comet from the solar system on a hyperbolic orbit (see future barycentric orbit).
See also Królikowska and Dybczyński 2017.
| solution description | ||
|---|---|---|
| number of observations | 97 | |
| data interval | 1955 01 13 – 1958 05 15 | |
| data type | perihelion within the observation arc (FULL) | |
| data arc selection | entire data set (STD) | |
| range of heliocentric distances | 5.16 au – 4.08 au (perihelion) – 7.79 au | |
| detectability of NG effects in the comet's motion | NG effects not determinable | |
| type of model of motion | GR - gravitational orbit | |
| data weighting | YES | |
| number of residuals | 181 | |
| RMS [arcseconds] | 0.98 | |
| orbit quality class | 1a | |
| previous orbit statistics, both Galactic and stellar perturbations were taken into account | ||
|---|---|---|
| no. of returning VCs in the swarm | 5001 | * |
| no. of escaping VCs in the swarm | 0 | |
| no. of hyperbolas among escaping VCs in the swarm | 0 | |
| previous reciprocal semi-major axis [10-6 au-1] | 33.05 – 36.01 – 39.08 | |
| previous perihelion distance [au] | 1100 – 1500 – 2000 | |
| previous aphelion distance [103 au] | 50.1 – 54 – 58.5 | |
| time interval to previous perihelion [Myr] | 3.7 – 4.2 – 4.9 | |
| percentage of VCs with qprev > 20 | 100 | |
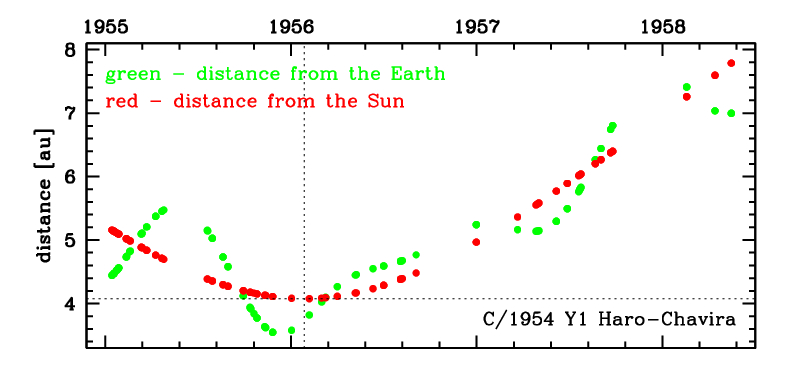
Time distribution of positional observations with corresponding heliocentric (red curve) and geocentric (green curve) distance at which they were taken. The horizontal dotted line shows the perihelion distance for a given comet whereas vertical dotted line — the moment of perihelion passage.
| previous_g orbit statistics, here only the Galactic tide has been included | ||
|---|---|---|
| no. of returning VCs in the swarm | 5001 | * |
| no. of escaping VCs in the swarm | 0 | |
| no. of hyperbolas among escaping VCs in the swarm | 0 | |
| previous reciprocal semi-major axis [10-6 au-1] | 34.77 – 38.17 – 41.52 | |
| previous perihelion distance [au] | 11 – 14 – 19 | |
| previous aphelion distance [103 au] | 48.2 – 52.4 – 57.5 | |
| time interval to previous perihelion [Myr] | 3.7 – 4.2 – 4.8 | |
| percentage of VCs with qprev < 10 | 6 | |
| percentage of VCs with 10 < qprev < 20 | 87 | |
| percentage of VCs with qprev > 20 | 7 | |