C/1975 E1 Bradfield
more info
Comet C/1975 E1 was discovered on 12 March 1975 by William A. Bradfield (Dernancourt, South Australia, Australia), that is about 3 weeks before its perihelion passage.This comet was observed until 5 April 1976. [Kronk, Cometography: Volume 6].
Comet had its closest approach to the Earth on 19 April 1975 (1.838 au), about 2 weeks after its perihelion passage.
Solution given here is based on data spanning over 0.977 yr in a range of heliocentric distances: 1.26 au – 1.217 au (perihelion) – 4.44 au.
This Oort spike comet suffers large planetary perturbations during its passage through the planetary system; these perturbations lead to escape the comet from the solar system on hyperbolic orbit.
See also Królikowska 2020.
| solution description | ||
|---|---|---|
| number of observations | 54 | |
| data interval | 1975 03 15 – 1976 03 07 | |
| data type | significantly more measurements after perihelion (POST+) | |
| data arc selection | entire data set (STD) | |
| range of heliocentric distances | 1.26 au – 1.22 au (perihelion) – 4.44 au | |
| detectability of NG effects in the comet's motion | NG effects not determinable | |
| type of model of motion | GR - gravitational orbit | |
| data weighting | NO | |
| number of residuals | 108 | |
| RMS [arcseconds] | 1.54 | |
| orbit quality class | 2a | |
| orbital elements (barycentric ecliptic J2000) | ||
|---|---|---|
| Epoch | 1676 06 03 | |
| perihelion date | 1975 04 03.57690852 | ± 0.00162376 |
| perihelion distance [au] | 1.20647029 | ± 0.00000783 |
| eccentricity | 0.99996777 | ± 0.00003043 |
| argument of perihelion [°] | 264.430573 | ± 0.001148 |
| ascending node [°] | 157.945252 | ± 0.000154 |
| inclination [°] | 55.244901 | ± 0.000144 |
| reciprocal semi-major axis [10-6 au-1] | 26.72 | ± 25.22 |
| file containing 5001 VCs swarm |
|---|
| 1975e1a1.bmi |
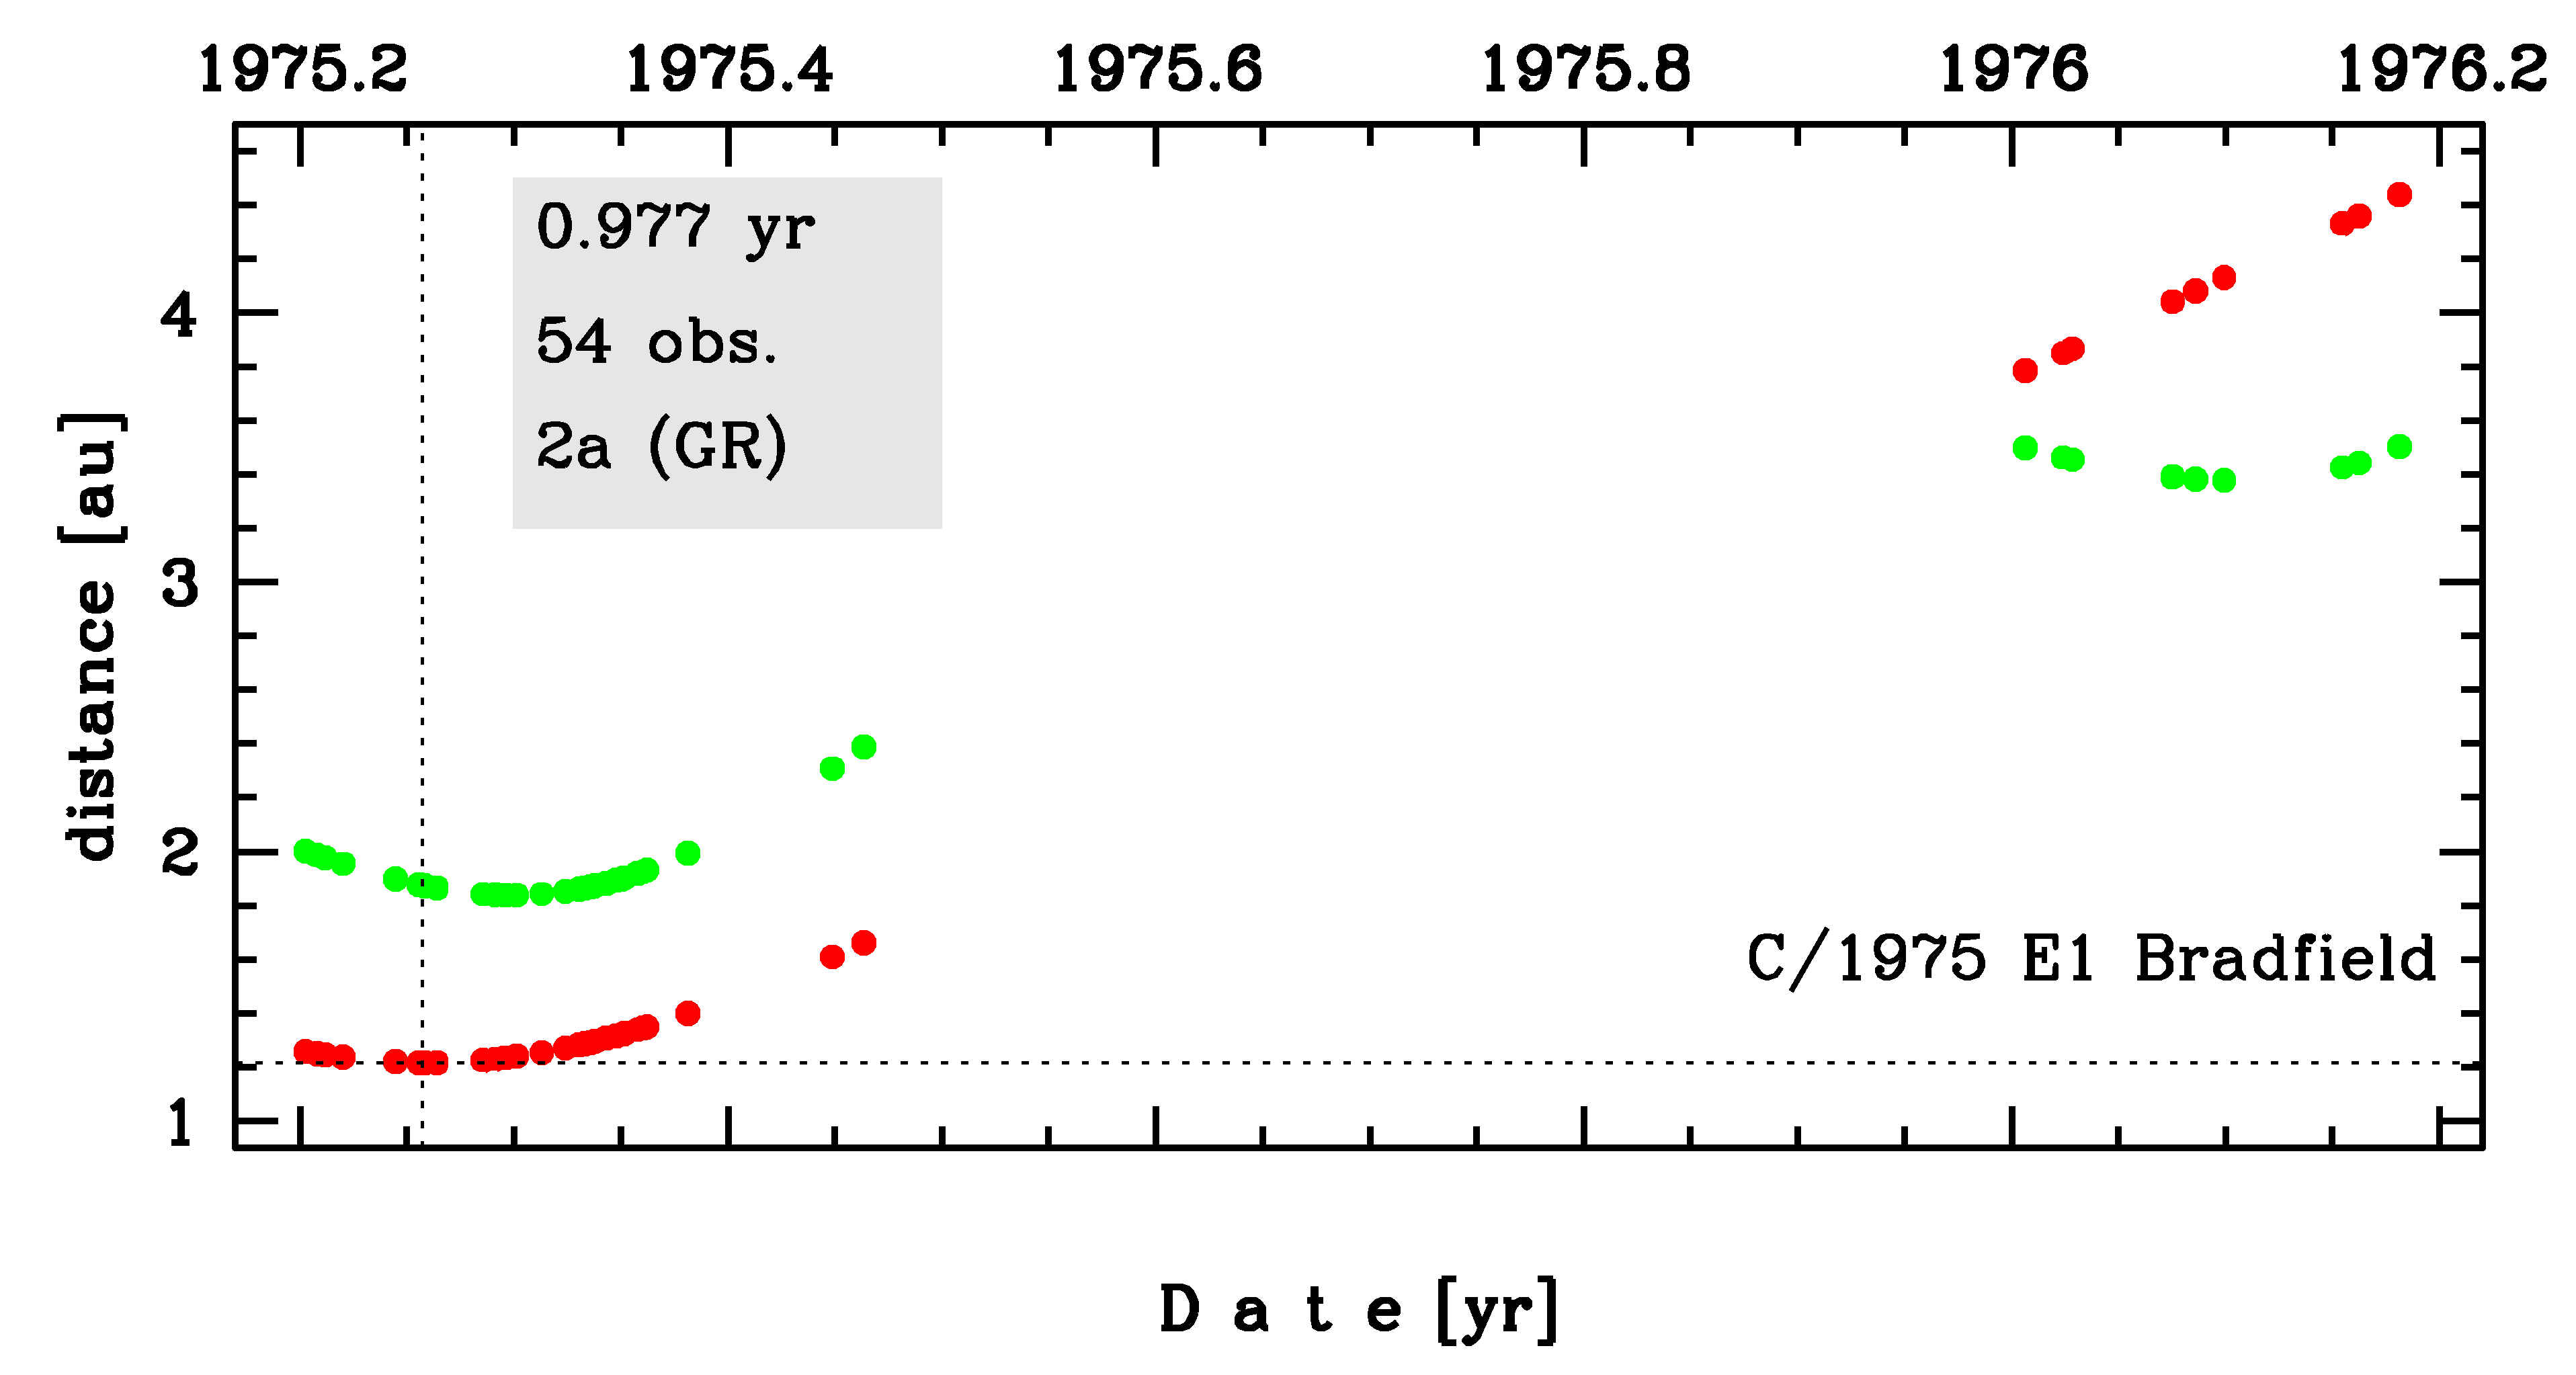
Time distribution of positional observations with corresponding heliocentric (red curve) and geocentric (green curve) distance at which they were taken. The horizontal dotted line shows the perihelion distance for a given comet whereas vertical dotted line — the moment of perihelion passage.
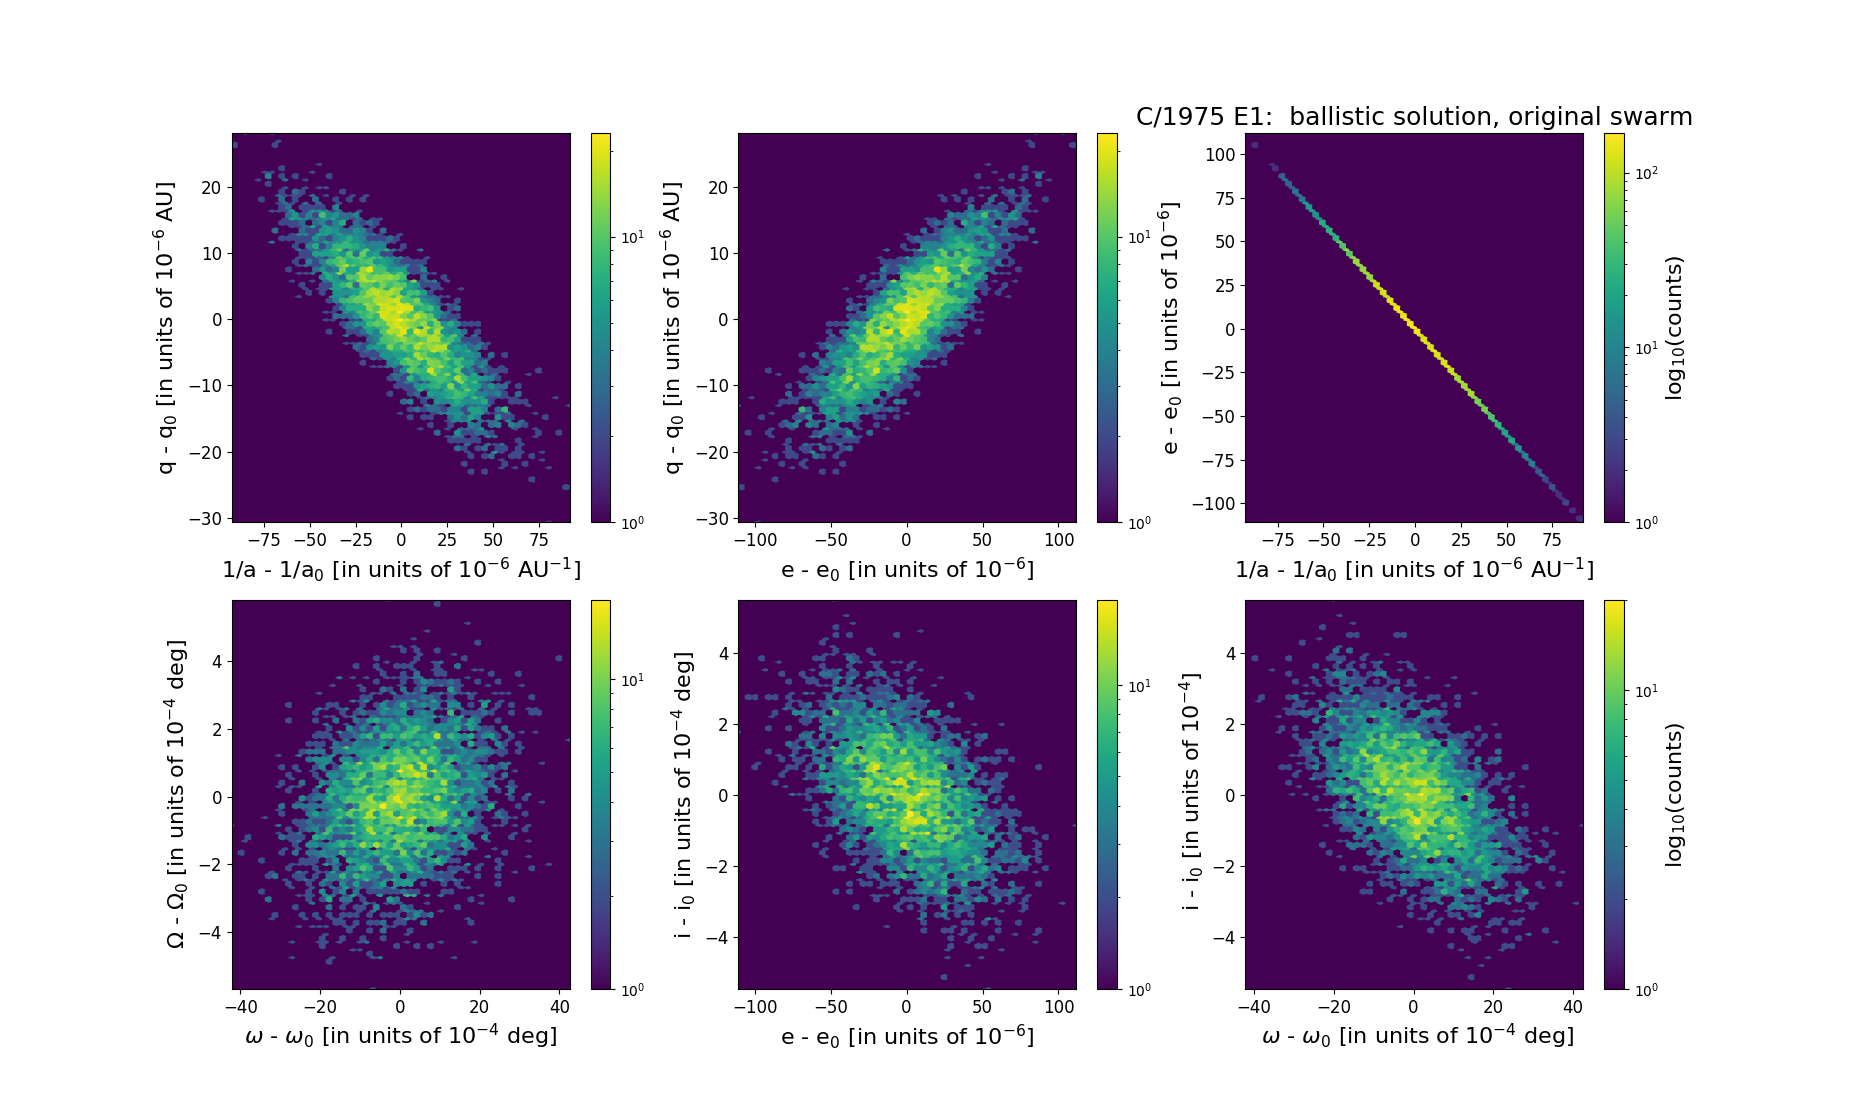
Six 2D-projections of the 6D space of original swarm including 5001 VCs. Each density map is given in logarithmic scale presented on the right in the individual panel.