C/1975 X1 Sato
more info
Comet C/1975 X1 was discovered on 5 December 1975 by Yasuo Sato (Tochigi, Japan), that is about almost a month before its perihelion passage. This comet was observed until beginning of February 1976.
Comet had its closest approach to the Earth on 19 December 1975 (0.282 au), 2 weeks after its discovery and about 2 weeks before its perihelion passage.
Solutions given here are based on data spanning over 0.156 yr in a range of heliocentric distances: 0.98 au – 0.864 au (perihelion) – 1.04 au.
Despite a very short arc of data, nongravitational orbits can be determined and results on decresing of RMS from 2.73 to 2.64 arcsec; however, NG orbits are very poor quality and uncertainties of NG parameters are relatively large.
Both NG orbits suggest that this is neither Oort spike comet nor interstellar comet.
See also Królikowska 2020.
| solution description | ||
|---|---|---|
| number of observations | 82 | |
| data interval | 1975 12 09 – 1976 02 04 | |
| data type | perihelion within the observation arc (FULL) | |
| data arc selection | entire data set (STD) | |
| range of heliocentric distances | 0.98 au – 0.86 au (perihelion) – 1.04 au | |
| type of model of motion | NS - non-gravitational orbits for standard g(r) | |
| data weighting | NO | |
| number of residuals | 161 | |
| RMS [arcseconds] | 2.64 | |
| orbit quality class | 3a | |
| orbital elements (barycentric ecliptic J2000) | ||
|---|---|---|
| Epoch | 1669 04 21 | |
| perihelion date | 1976 01 03.39771796 | ± 0.00437787 |
| perihelion distance [au] | 0.86108594 | ± 0.00004048 |
| eccentricity | 0.99936012 | ± 0.00048985 |
| argument of perihelion [°] | 215.624096 | ± 0.008859 |
| ascending node [°] | 281.548933 | ± 0.002859 |
| inclination [°] | 93.984665 | ± 0.004344 |
| reciprocal semi-major axis [10-6 au-1] | 743.11 | ± 568.91 |
| file containing 5001 VCs swarm |
|---|
| 1975x1n1.bmi |
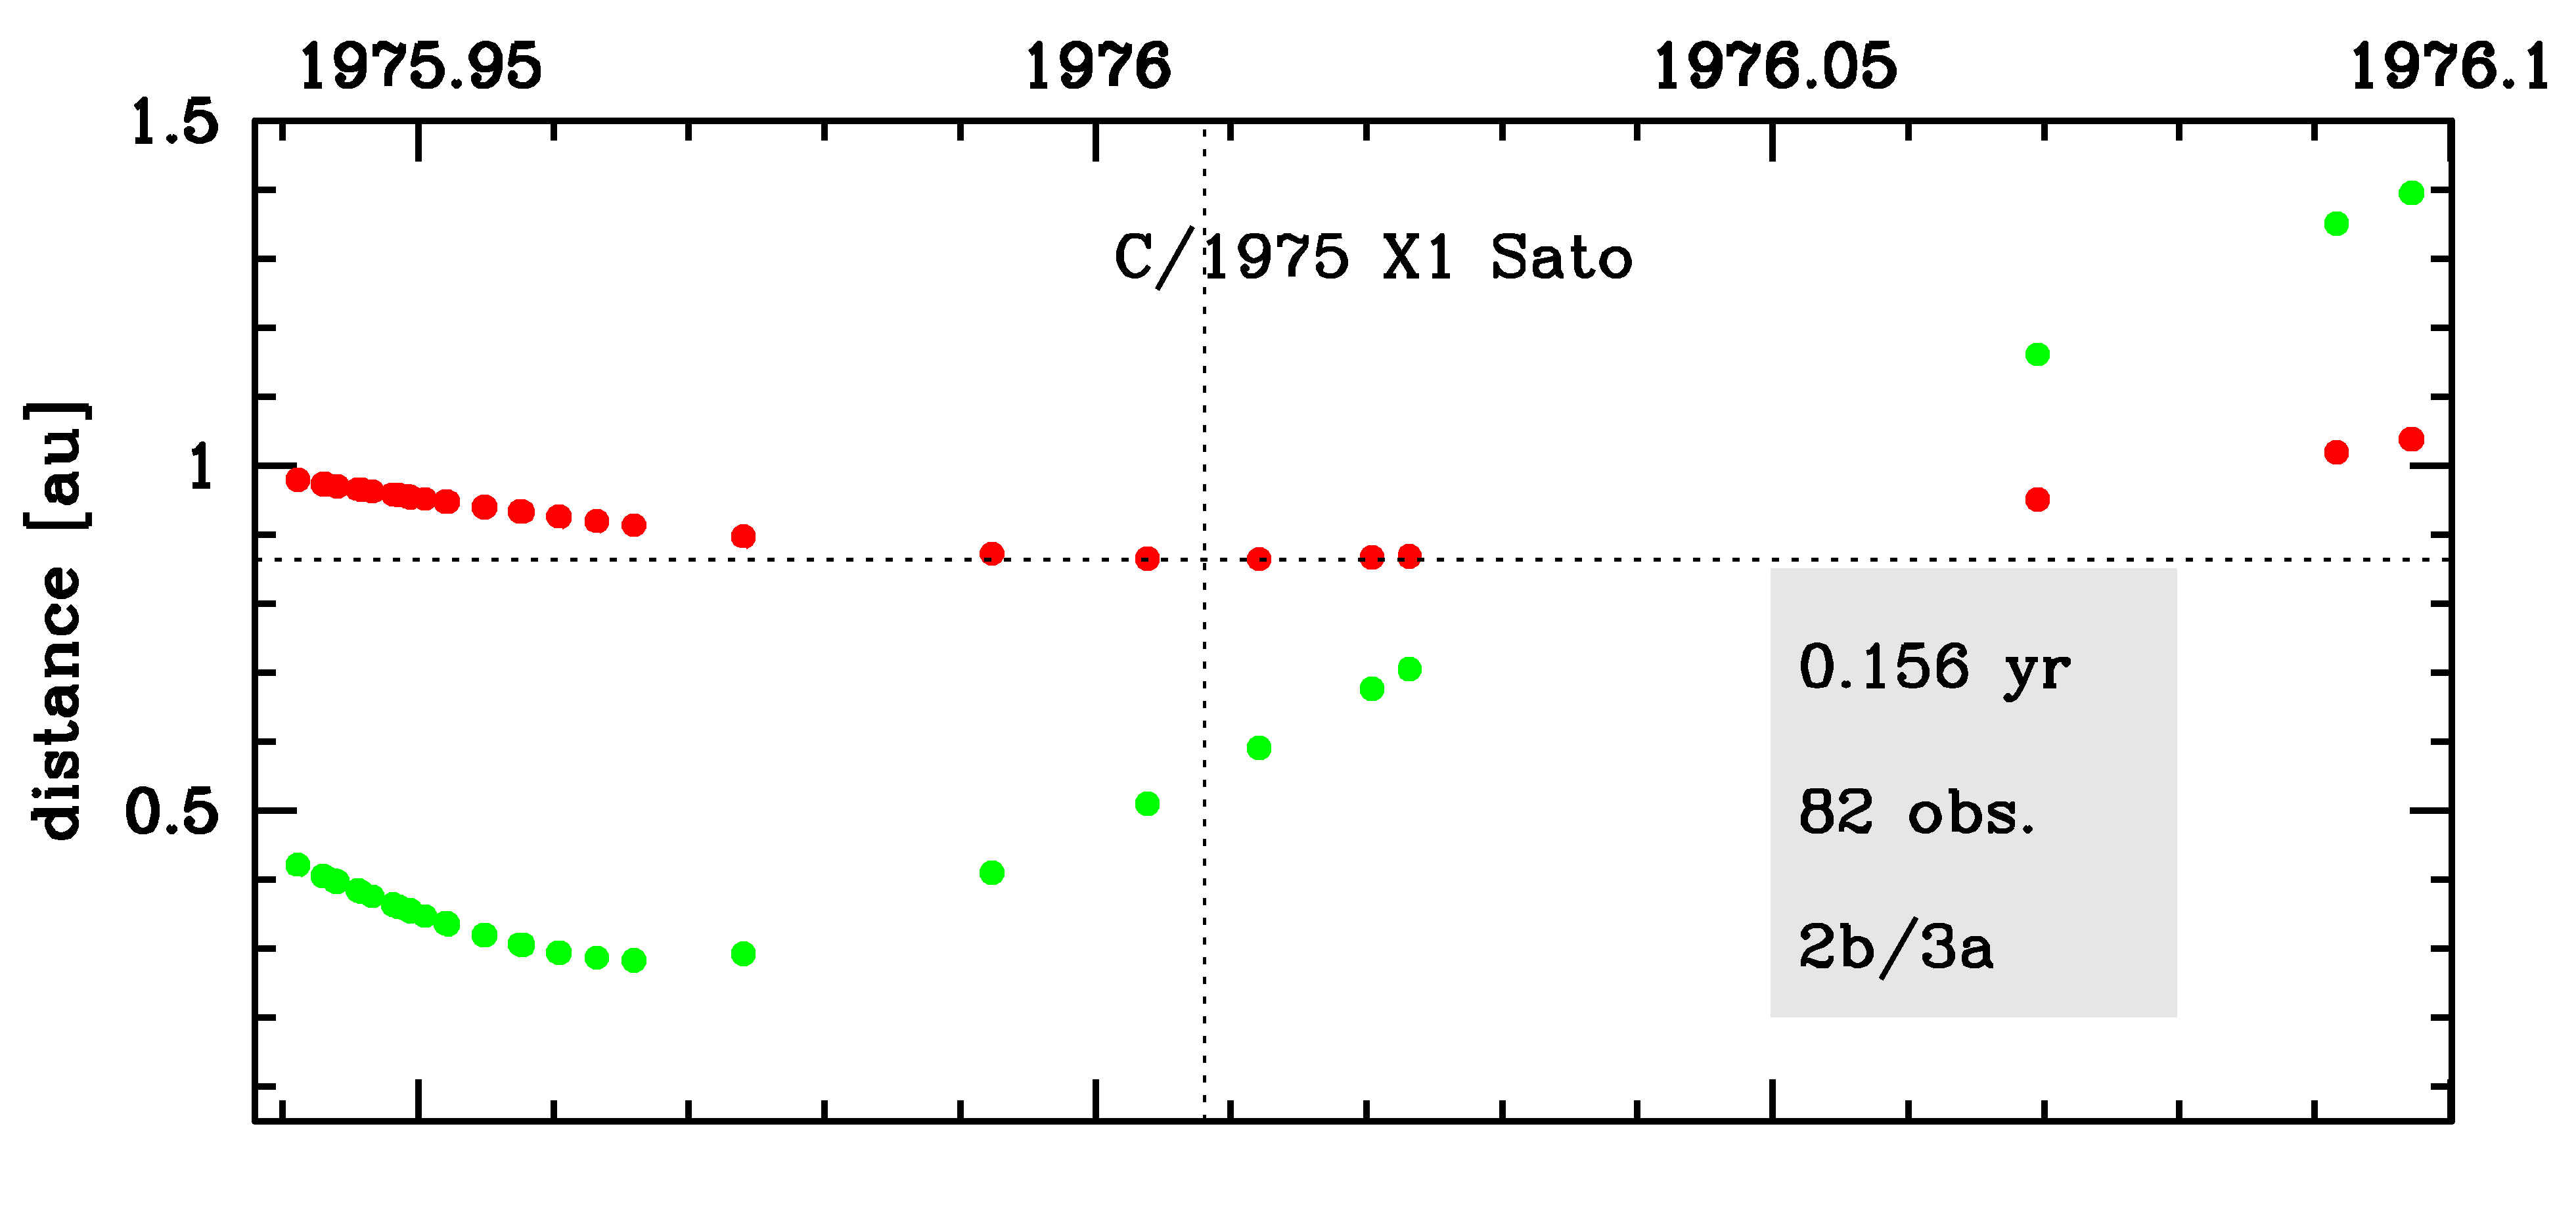
Time distribution of positional observations with corresponding heliocentric (red curve) and geocentric (green curve) distance at which they were taken. The horizontal dotted line shows the perihelion distance for a given comet whereas vertical dotted line — the moment of perihelion passage.
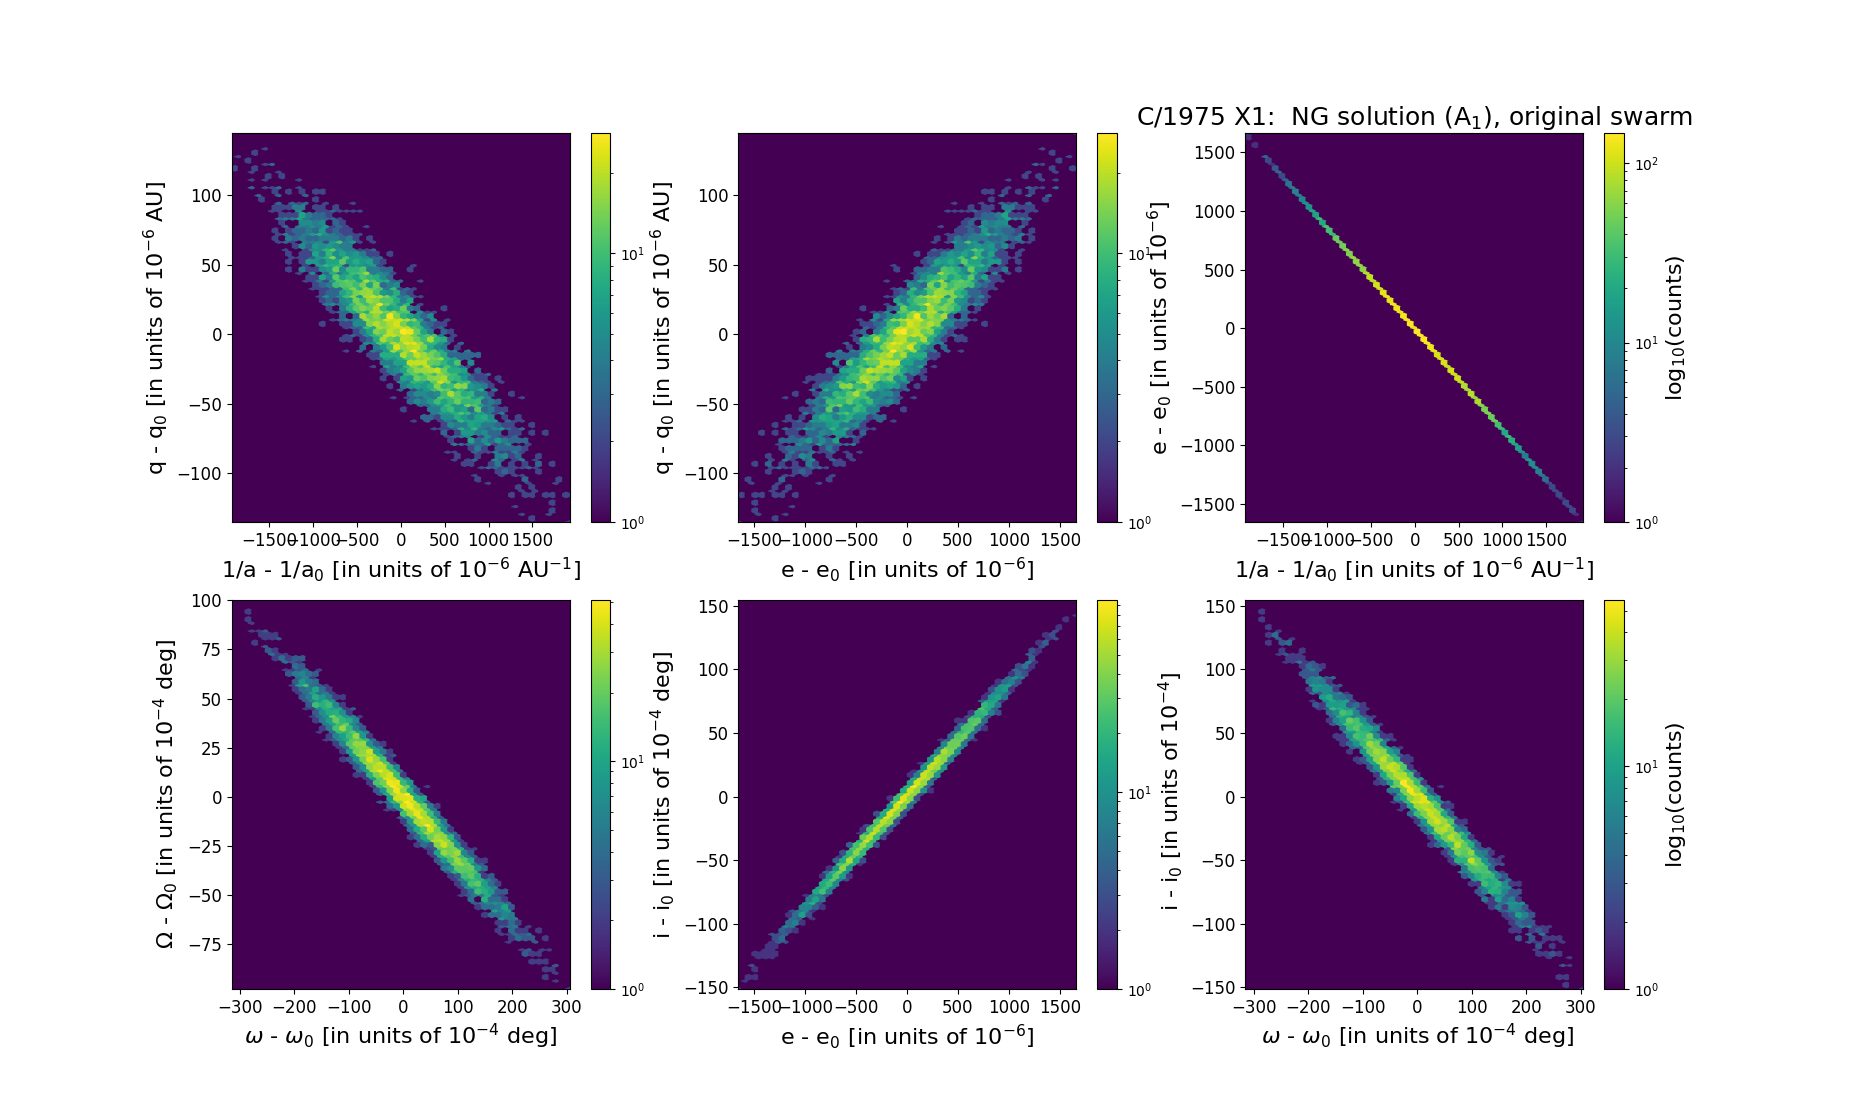
Six 2D-projections of the 6D space of original swarm including 5001 VCs. Each density map is given in logarithmic scale presented on the right in the individual panel.