C/1979 M1 Bradfield
more info
Comet C/1979 M1 was discovered on 24 June 1979 by William A. Bradfield (Dernancourt, South Australia, Australia), that is a month before its perihelion passage. This comet was last observed in late September 1979.
Comet had its closest approach to the Earth on 15 September 1979 (0.431 au), less than two months after perihelion passage.
Solutions given here are based on data spanning over 0.249 yr in a range of heliocentric distances: 0.80 au – 0.413 au (perihelion) – 1.44 au.
This Oort spike comet suffers small planetary perturbations during its passage through the planetary system; these perturbations lead to a little more tight future orbit.
See also Królikowska 2020.
| solution description | ||
|---|---|---|
| number of observations | 35 | |
| data interval | 1979 06 25 – 1979 09 24 | |
| data type | perihelion within the observation arc (FULL) | |
| data arc selection | entire data set (STD) | |
| range of heliocentric distances | 0.8 au – 0.41 au (perihelion) – 1.44 au | |
| detectability of NG effects in the comet's motion | NG effects not determinable | |
| type of model of motion | GR - gravitational orbit | |
| data weighting | NO | |
| number of residuals | 68 | |
| RMS [arcseconds] | 3.28 | |
| orbit quality class | 2a | |
| previous orbit statistics, both Galactic and stellar perturbations were taken into account | ||
|---|---|---|
| no. of returning VCs in the swarm | 3937 | * |
| no. of escaping VCs in the swarm | 1064 | |
| no. of hyperbolas among escaping VCs in the swarm | 530 | |
| previous reciprocal semi-major axis [10-6 au-1] | -0.81 – 39.76 – 82.81 | |
| previous perihelion distance [au] | 0.16 – 250 – 3100 | R |
| previous aphelion distance [103 au] | 24 – 46 – 170 | |
| time interval to previous perihelion [Myr] | 1.2 – 2.9 – 8.6 | R |
| percentage of VCs with qprev < 10 | 41 | |
| percentage of VCs with qprev > 20 | 59 | |
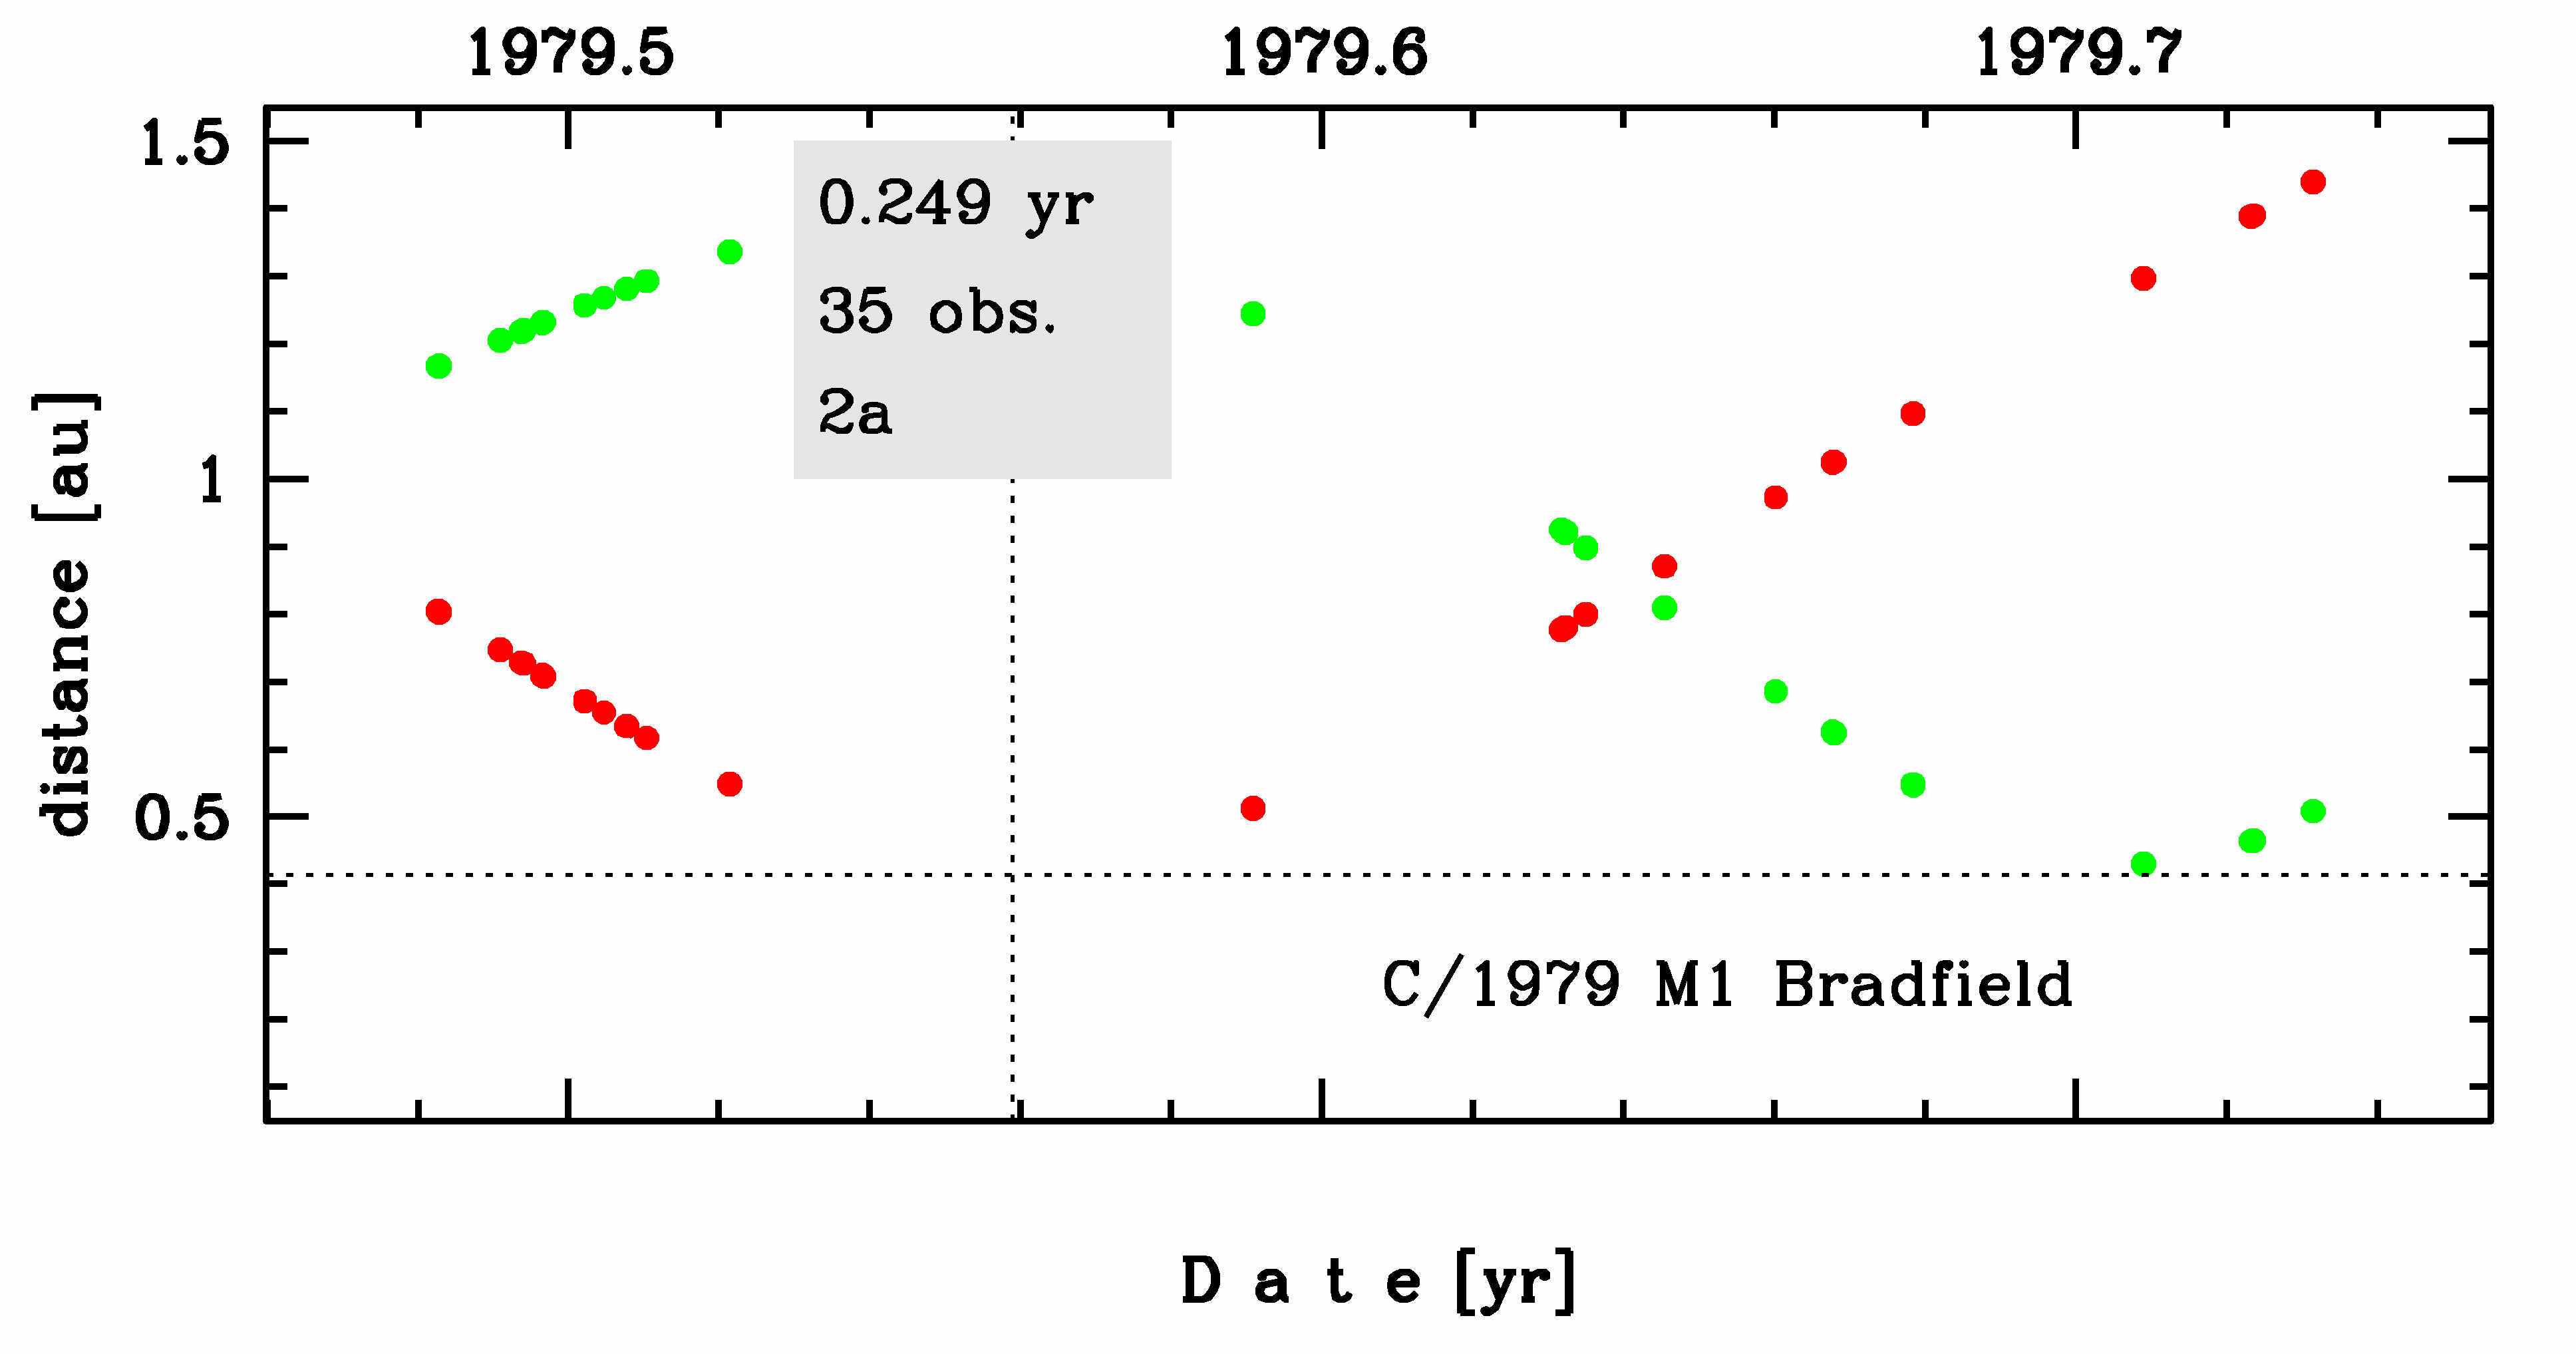
Time distribution of positional observations with corresponding heliocentric (red curve) and geocentric (green curve) distance at which they were taken. The horizontal dotted line shows the perihelion distance for a given comet whereas vertical dotted line — the moment of perihelion passage.
| previous_g orbit statistics, here only the Galactic tide has been included | ||
|---|---|---|
| no. of returning VCs in the swarm | 3827 | * |
| no. of escaping VCs in the swarm | 1174 | |
| no. of hyperbolas among escaping VCs in the swarm | 534 | |
| previous reciprocal semi-major axis [10-6 au-1] | -1.09 – 39.68 – 82.79 | |
| previous perihelion distance [au] | 0.25 – 0.76 – 180 | R |
| previous aphelion distance [103 au] | 24 – 46 – 170 | |
| time interval to previous perihelion [Myr] | 1.2 – 2.9 – 8.5 | R |
| percentage of VCs with qprev < 10 | 72 | |
| percentage of VCs with 10 < qprev < 20 | 5 | |
| percentage of VCs with qprev > 20 | 23 | |