C/1979 M3 Torres
more info
Comet C/1979 M3 was discovered on 26 June 1979, almost 3 weeks before its perihelion passage, and was last seen on 23 October 1979 [Kronk and Meyer, Cometography: Volume 5]; later few prediscovery measurements going back up to 23 August 1978 were found, that is 11 months before its perihelion passage (see figure).
This comet made its closest approach to the Earth on 14 July 1979 (3.69 au), that was almost exactly at the moment of perihelion passage.
Solution given here is based on data spanning over 1.17 yr in a range of heliocentric distances: 5.34 au – 4.69 au (perihelion) – 4.75 au.
This Oort spike comet suffers rather small planetary perturbations during its passage through the planetary system that lead to escape the comet from the planetary zone on a hyperbolic orbit (see future barycentric orbit).
See also Królikowska 2014 and Królikowska and Dybczyński 2017.
| solution description | ||
|---|---|---|
| number of observations | 34 | |
| data interval | 1978 08 23 – 1979 10 23 | |
| data type | perihelion within the observation arc (FULL) | |
| data arc selection | entire data set (STD) | |
| range of heliocentric distances | 5.34 au – 4.69 au (perihelion) – 4.75 au | |
| detectability of NG effects in the comet's motion | NG effects not determinable | |
| type of model of motion | GR - gravitational orbit | |
| data weighting | NO | |
| number of residuals | 64 | |
| RMS [arcseconds] | 1.34 | |
| orbit quality class | 1b | |
| next orbit statistics, both Galactic and stellar perturbations were taken into account | ||
|---|---|---|
| no. of returning VCs in the swarm | 0 | |
| no. of escaping VCs in the swarm | 5001 | |
| no. of hyperbolas among escaping VCs in the swarm | 5001 | * |
| next reciprocal semi-major axis [10-6 au-1] | -163.65 – -144.99 – -126.27 | |
| next perihelion distance [au] | 7.39 – 7.79 – 8.2 | |
| synchronous stop epoch [Myr] | 1.19 | S |
| percentage of VCs with qnext < 10 | 100 | |
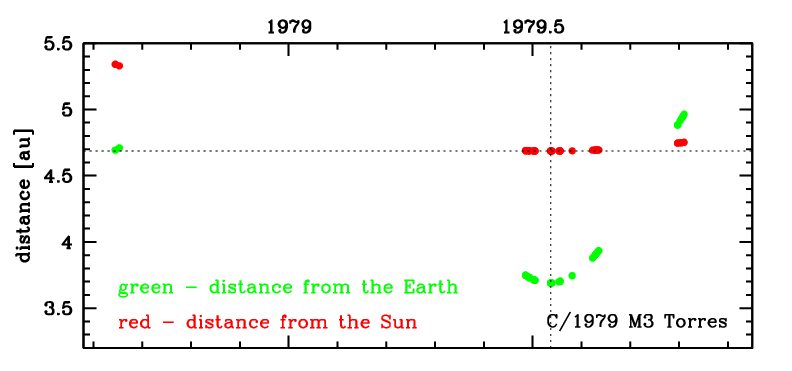
Time distribution of positional observations with corresponding heliocentric (red curve) and geocentric (green curve) distance at which they were taken. The horizontal dotted line shows the perihelion distance for a given comet whereas vertical dotted line — the moment of perihelion passage.
| next_g orbit statistics, here only the Galactic tide has been included | ||
|---|---|---|
| no. of returning VCs in the swarm | 0 | |
| no. of escaping VCs in the swarm | 5001 | |
| no. of hyperbolas among escaping VCs in the swarm | 5001 | * |
| next reciprocal semi-major axis [10-6 au-1] | -163.62 – -144.96 – -126.23 | |
| next perihelion distance [au] | 6.41 – 6.66 – 6.92 | |
| synchronous stop epoch [Myr] | 1.2 | S |
| percentage of VCs with qnext < 10 | 100 | |