C/1984 W2 Hartley
more info
Comet C/1984 W2 was discovered by Malcolm Hartley (1.2-m Schmidt telescope at Siding Spring) on 17 November 1984 (IAUC 4015), more than ten months before its perihelion passage. The comet was last seen on 18 May 1988.
The comet made its closest approach to the Earth on 11 December 1984 (3.89 au), that was three weeks after its discovery; in the next opposition the comet has closest approach to the Earth within 4.00 au (on 19 October 1985).
Solutions given here are based on data spanning over 3.50 yr in a range of heliocentric distances: 4.80 au – 4.00 au (perihelion) – 8.52 au.
This Oort spike comet suffers slight planetary perturbations during its passage through the planetary system but these perturbations can lead to escape of the comet from the solar system.
See also Królikowska 2014 and Królikowska and Dybczyński 2017.
| solution description | ||
|---|---|---|
| number of observations | 54 | |
| data interval | 1984 11 17 – 1988 05 18 | |
| data type | perihelion within the observation arc (FULL) | |
| data arc selection | entire data set (STD) | |
| range of heliocentric distances | 4.8 au – 4.00 au (perihelion) – 8.52 au | |
| type of model of motion | NS - non-gravitational orbits for standard g(r) | |
| data weighting | NO | |
| number of residuals | 107 | |
| RMS [arcseconds] | 1.87 | |
| orbit quality class | 1a | |
| orbital elements (barycentric ecliptic J2000) | ||
|---|---|---|
| Epoch | 1682 02 12 | |
| perihelion date | 1985 09 29.03831500 | ± 0.01407600 |
| perihelion distance [au] | 4.00453691 | ± 0.00004945 |
| eccentricity | 0.99991890 | ± 0.00003430 |
| argument of perihelion [°] | 255.286662 | ± 0.002360 |
| ascending node [°] | 250.227075 | ± 0.000102 |
| inclination [°] | 89.263792 | ± 0.000096 |
| reciprocal semi-major axis [10-6 au-1] | 20.25 | ± 8.56 |
| file containing 5001 VCs swarm |
|---|
| 1984w2n2.bmi |
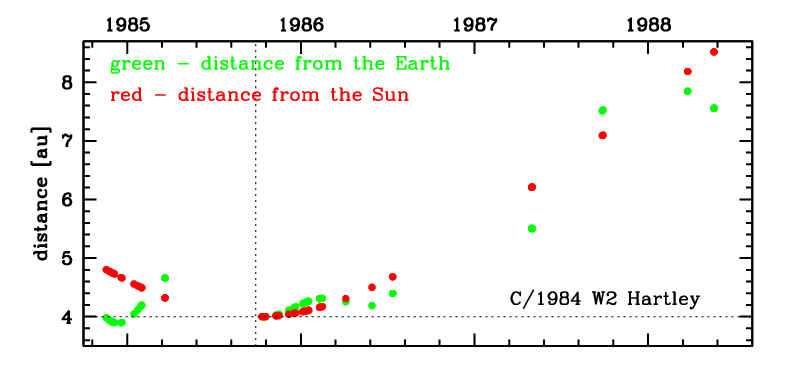
Time distribution of positional observations with corresponding heliocentric (red curve) and geocentric (green curve) distance at which they were taken. The horizontal dotted line shows the perihelion distance for a given comet whereas vertical dotted line — the moment of perihelion passage.
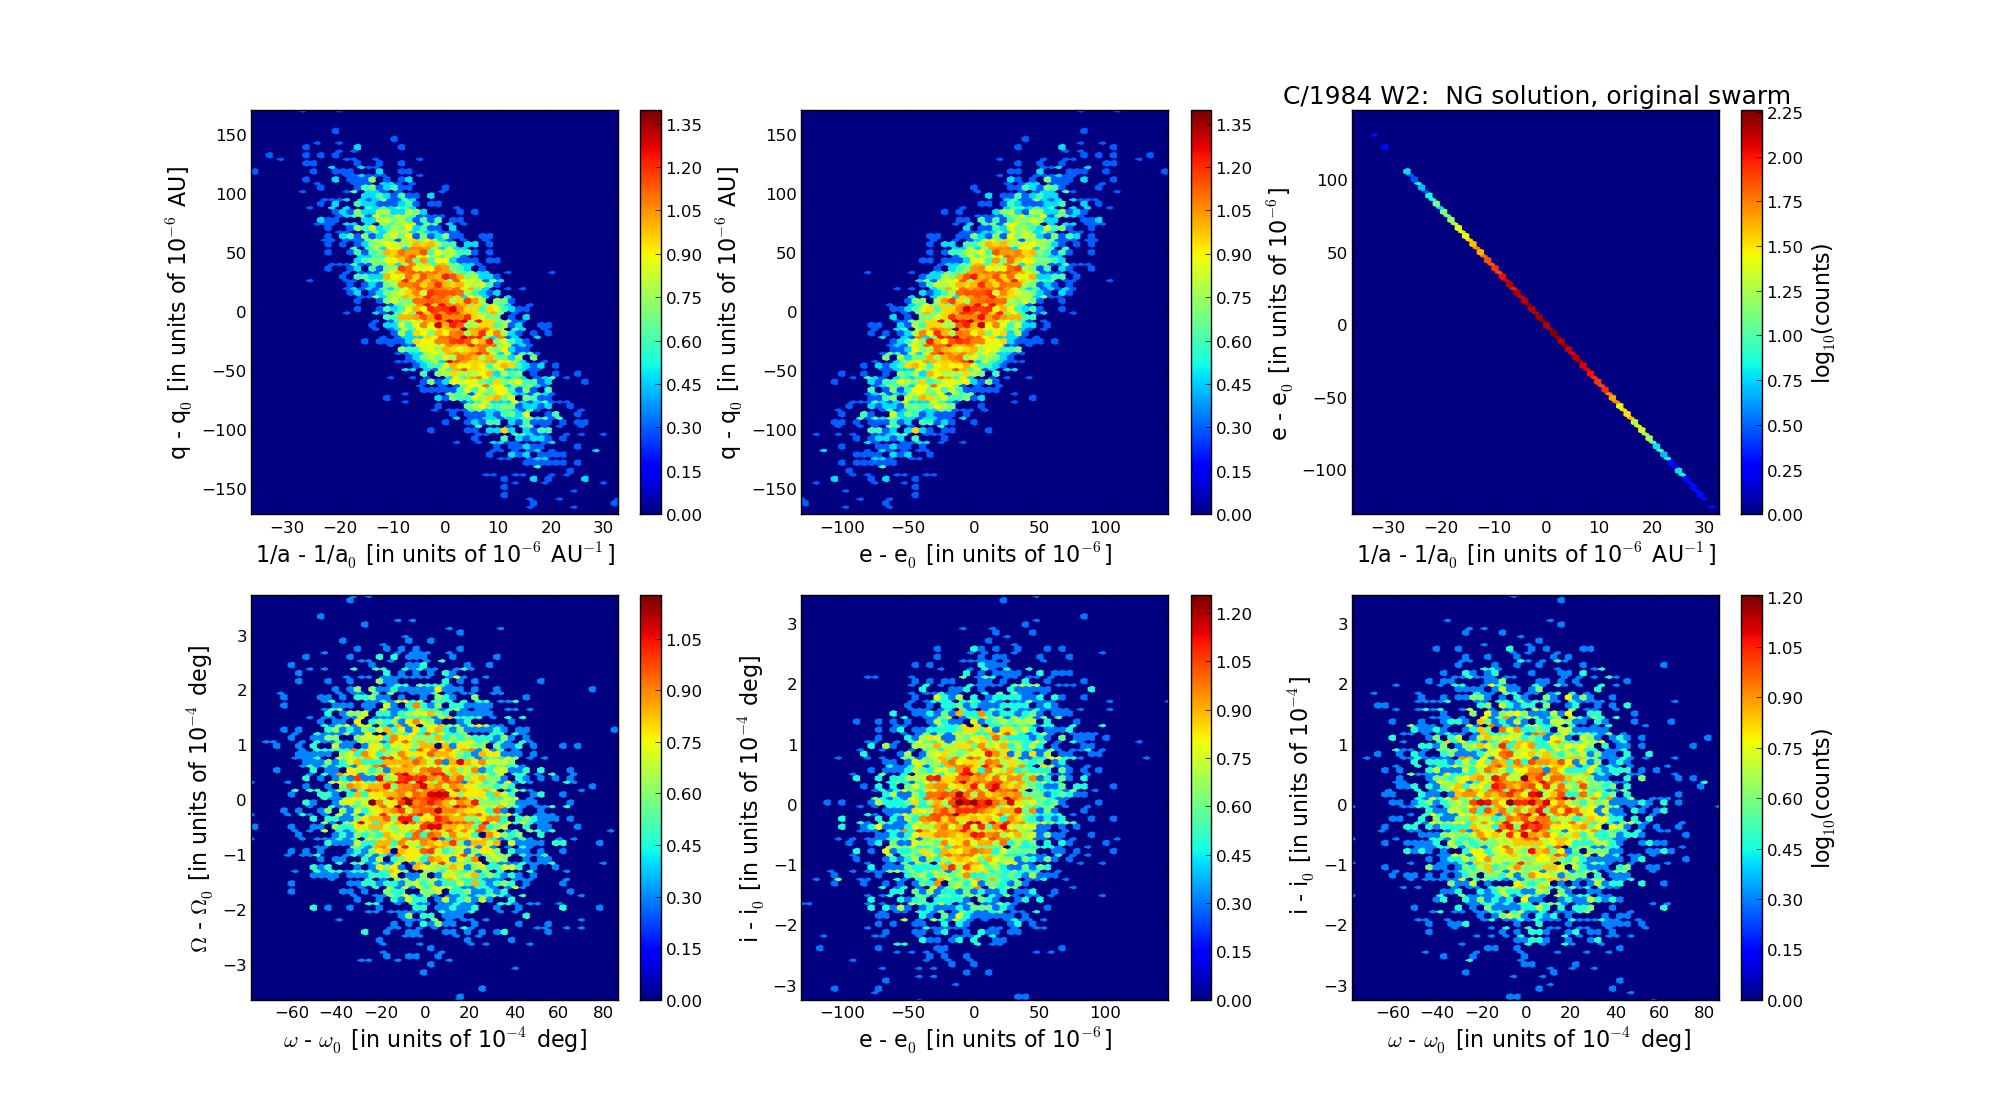
Six 2D-projections of the 6D space of original swarm including 5001 VCs. Each density map is given in logarithmic scale presented on the right in the individual panel.