C/1992 J1 Spacewatch
more info
Comet C/1992 J1 was discovered on 1 May 1992 by by David Rabinowitz of the Spacewatch Project thanks to automated system able to detect moving objects (first such a case). At the moment of discovery, the comet was about 1.3 year before its perihelion passage. This comet was last observed in the second half of March 1993.
Comet had its closest approaches to the Earth on 23 March 1993 (2.662 au, before perihelion passage), and on 10 December 1993 (2.659 au, after perihelion passage).
Solution given here is based on data spanning over 2.79 yr in a range of heliocentric distances: 5.46 au – 3.01 au (perihelion) – 5.61 au.
This Oort spike comet suffers moderate planetary perturbations during its passage through the planetary system; these perturbations lead to more tight future orbit with a semimajor axis of about 1,800 au.
See also Królikowska 2020.
| solution description | ||
|---|---|---|
| number of observations | 248 | |
| data interval | 1992 05 01 – 1995 02 02 | |
| data type | perihelion within the observation arc (FULL) | |
| data arc selection | entire data set (STD) | |
| range of heliocentric distances | 5.46 au – 3.01 au (perihelion) – 5.61 au | |
| detectability of NG effects in the comet's motion | NG effects not determinable | |
| type of model of motion | GR - gravitational orbit | |
| data weighting | YES | |
| number of residuals | 493 | |
| RMS [arcseconds] | 0.75 | |
| orbit quality class | 1a+ | |
| next orbit statistics, both Galactic and stellar perturbations were taken into account | ||
|---|---|---|
| no. of returning VCs in the swarm | 5001 | * |
| no. of escaping VCs in the swarm | 0 | |
| no. of hyperbolas among escaping VCs in the swarm | 0 | |
| next reciprocal semi-major axis [10-6 au-1] | 545.76 – 546.96 – 548.21 | |
| next perihelion distance [au] | 3.0004 – 3.00041 – 3.00042 | |
| next aphelion distance [103 au] | 3.645 – 3.654 – 3.662 | |
| time interval to next perihelion [Myr] | 0.07757 – 0.07783 – 0.07809 | |
| percentage of VCs with qnext < 10 | 100 | |
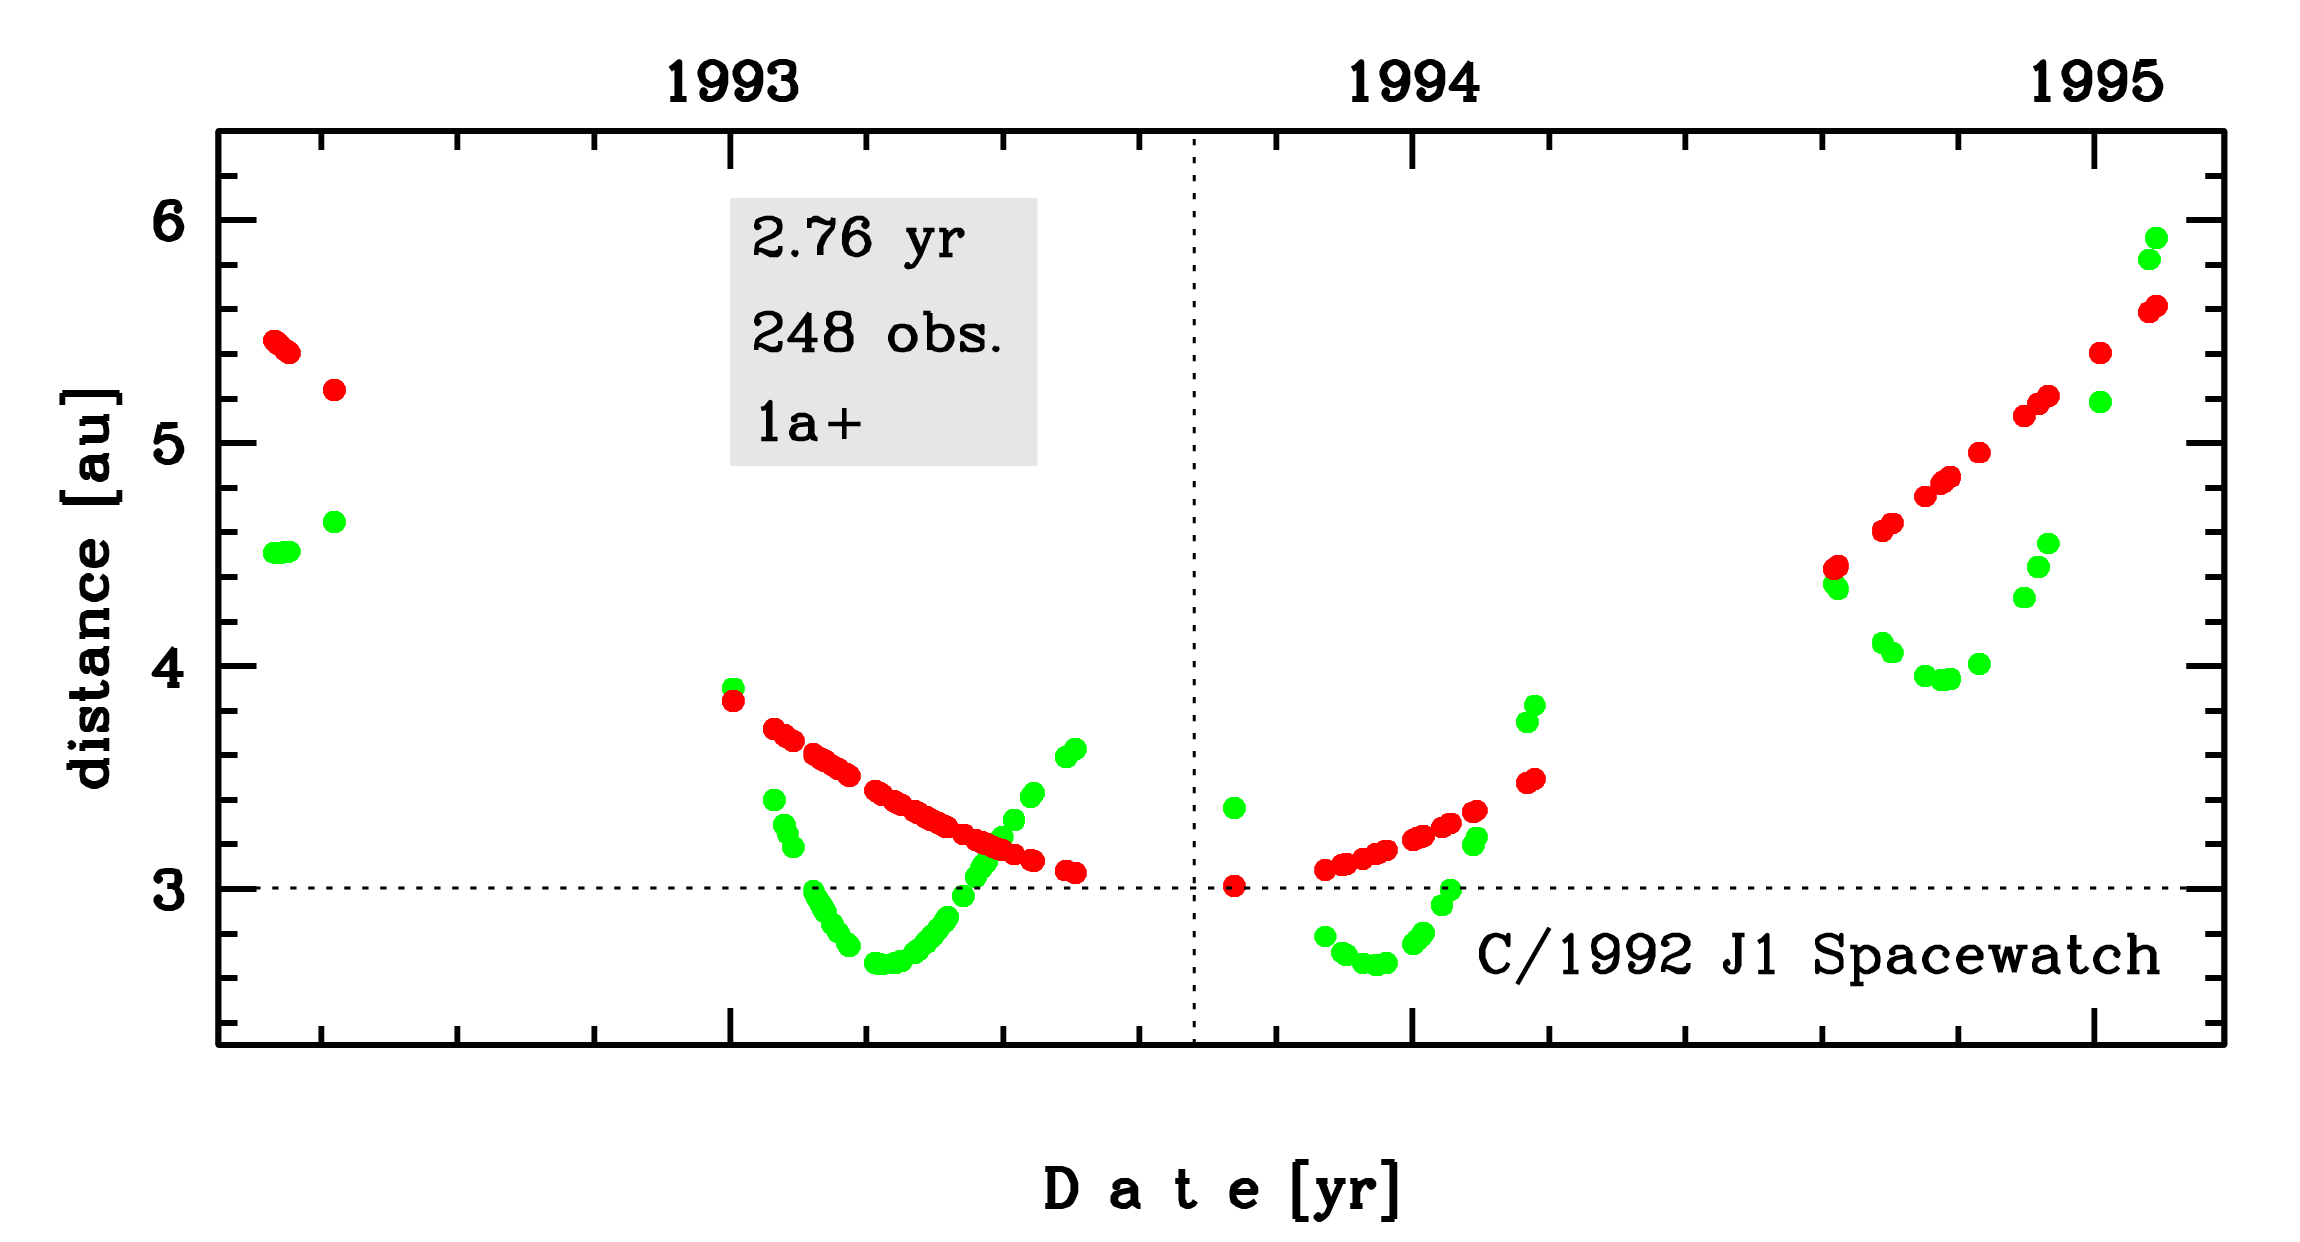
Time distribution of positional observations with corresponding heliocentric (red curve) and geocentric (green curve) distance at which they were taken. The horizontal dotted line shows the perihelion distance for a given comet whereas vertical dotted line — the moment of perihelion passage.
| next_g orbit statistics, here only the Galactic tide has been included | ||
|---|---|---|
| no. of returning VCs in the swarm | 5001 | * |
| no. of escaping VCs in the swarm | 0 | |
| no. of hyperbolas among escaping VCs in the swarm | 0 | |
| next reciprocal semi-major axis [10-6 au-1] | 545.76 – 546.96 – 548.21 | |
| next perihelion distance [au] | 3.00456 – 3.00457 – 3.00458 | |
| next aphelion distance [103 au] | 3.645 – 3.654 – 3.662 | |
| time interval to next perihelion [Myr] | 0.07753 – 0.0778 – 0.07809 | |
| percentage of VCs with qnext < 10 | 100 | |