C/1993 A1 Mueller
more info
Comet C/1993 A1 was discovered on 2 January 1993 by Jean Mueller (Palomar Sky Survey II). Later, a prediscovery image of this comet taken on 26 November 1992 (Catalina Station, Tucson) was found.At the moment of discovery, this comet was a year before its perihelion passage and it was last observed in the mid-August 1994.
Comet had its closest approach to the Earth on 13 November 1993 (1.713 au), 2 months before its perihelion passage.
This is a comet with nongravitational effects strongly manifested in positional data fitting.
Preferred solution given here is based on data spanning over 1.72 yr in a range of heliocentric distances: 4.89 au – 1.94 au (perihelion) – 3.19 au.
This Oort spike comet suffers moderate planetary perturbations during its passage through the planetary system; these perturbations lead to escape the comet on hyperbolic orbit from the planetary zone.See also Królikowska 2020.
| solution description | ||
|---|---|---|
| number of observations | 739 | |
| data interval | 1992 11 26 – 1994 08 17 | |
| data type | perihelion within the observation arc (FULL) | |
| data arc selection | entire data set (STD) | |
| range of heliocentric distances | 4.89 au – 1.94 au (perihelion) – 3.19 au | |
| type of model of motion | NC - non-gravitational orbits for symmetric CO-g(r)-like function | |
| data weighting | YES | |
| number of residuals | 1467 | |
| RMS [arcseconds] | 0.87 | |
| orbit quality class | 1a | |
| orbital elements (barycentric ecliptic J2000) | ||
|---|---|---|
| Epoch | 2288 03 07 | |
| perihelion date | 1994 01 13.98304953 | ± 0.00035538 |
| perihelion distance [au] | 1.93422047 | ± 0.00001057 |
| eccentricity | 1.00099354 | ± 0.00000871 |
| argument of perihelion [°] | 130.703764 | ± 0.000342 |
| ascending node [°] | 144.875811 | ± 0.000020 |
| inclination [°] | 124.891089 | ± 0.000067 |
| reciprocal semi-major axis [10-6 au-1] | -513.67 | ± 4.50 |
| file containing 5001 VCs swarm |
|---|
| 1993a1c5.bpl |
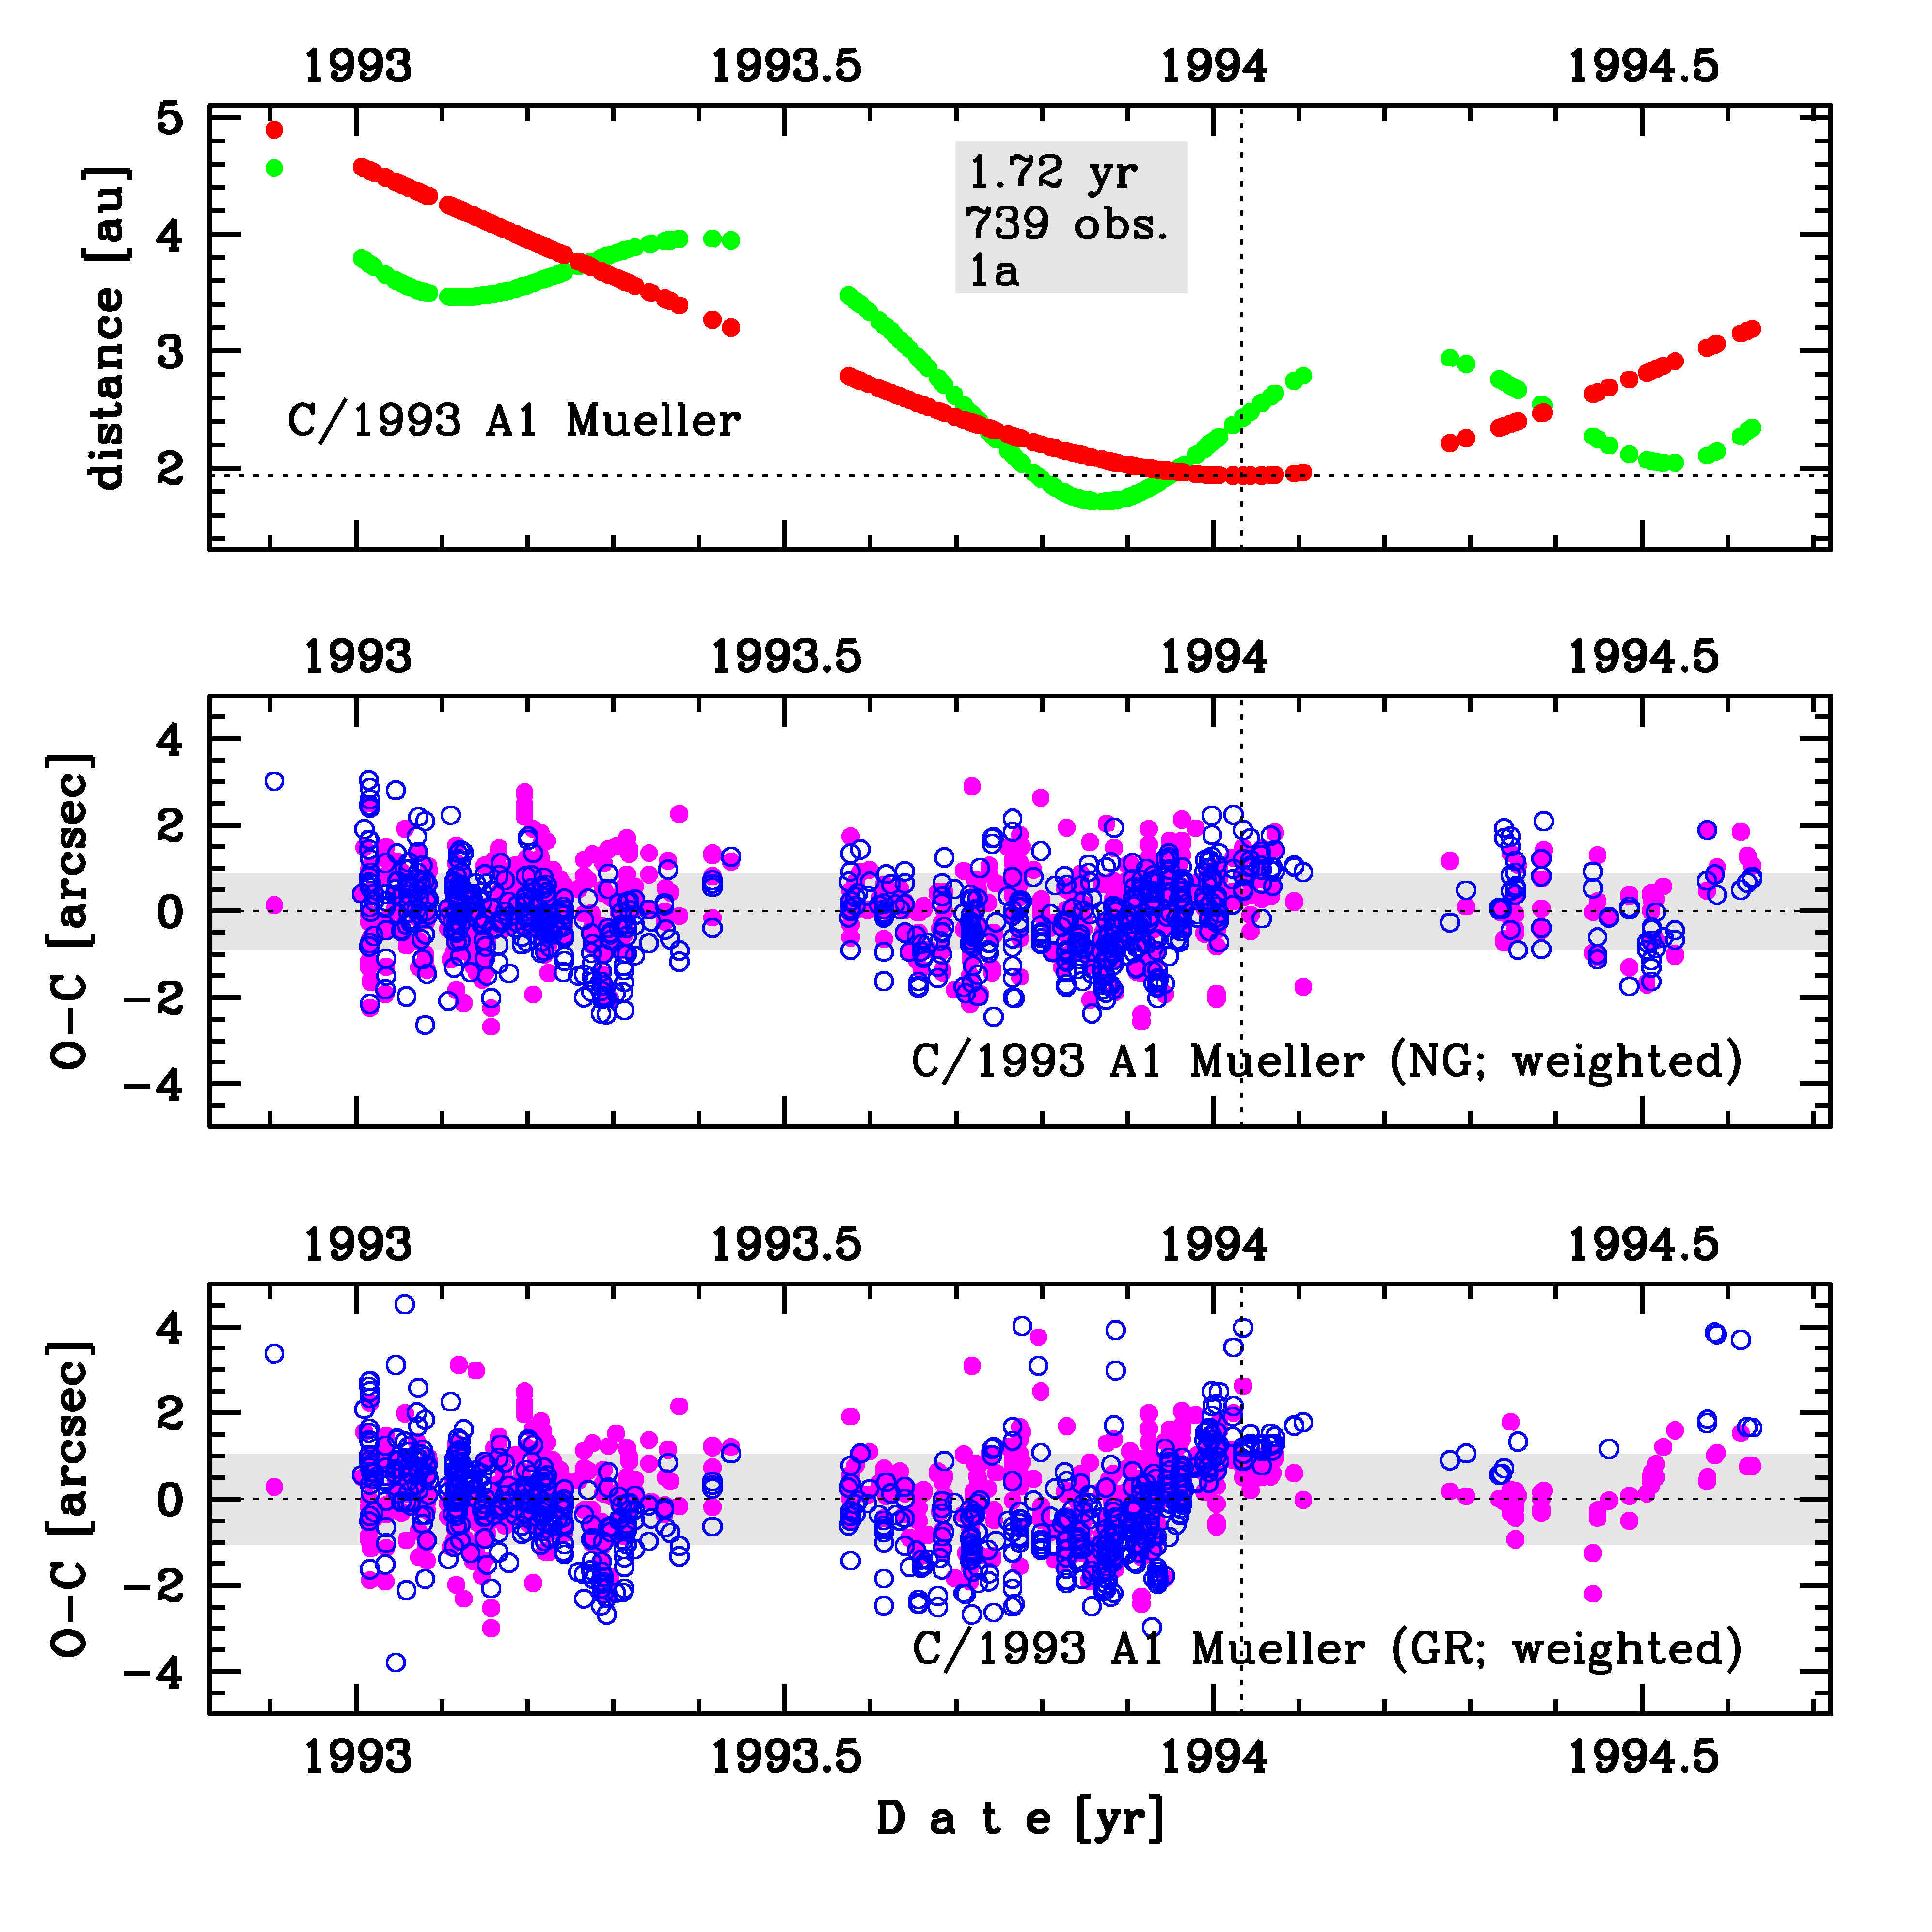
Time distribution of positional observations with corresponding heliocentric (red curve) and geocentric (green curve) distance at which they were taken. The horizontal dotted line shows the perihelion distance for a given comet whereas vertical dotted line — the moment of perihelion passage.
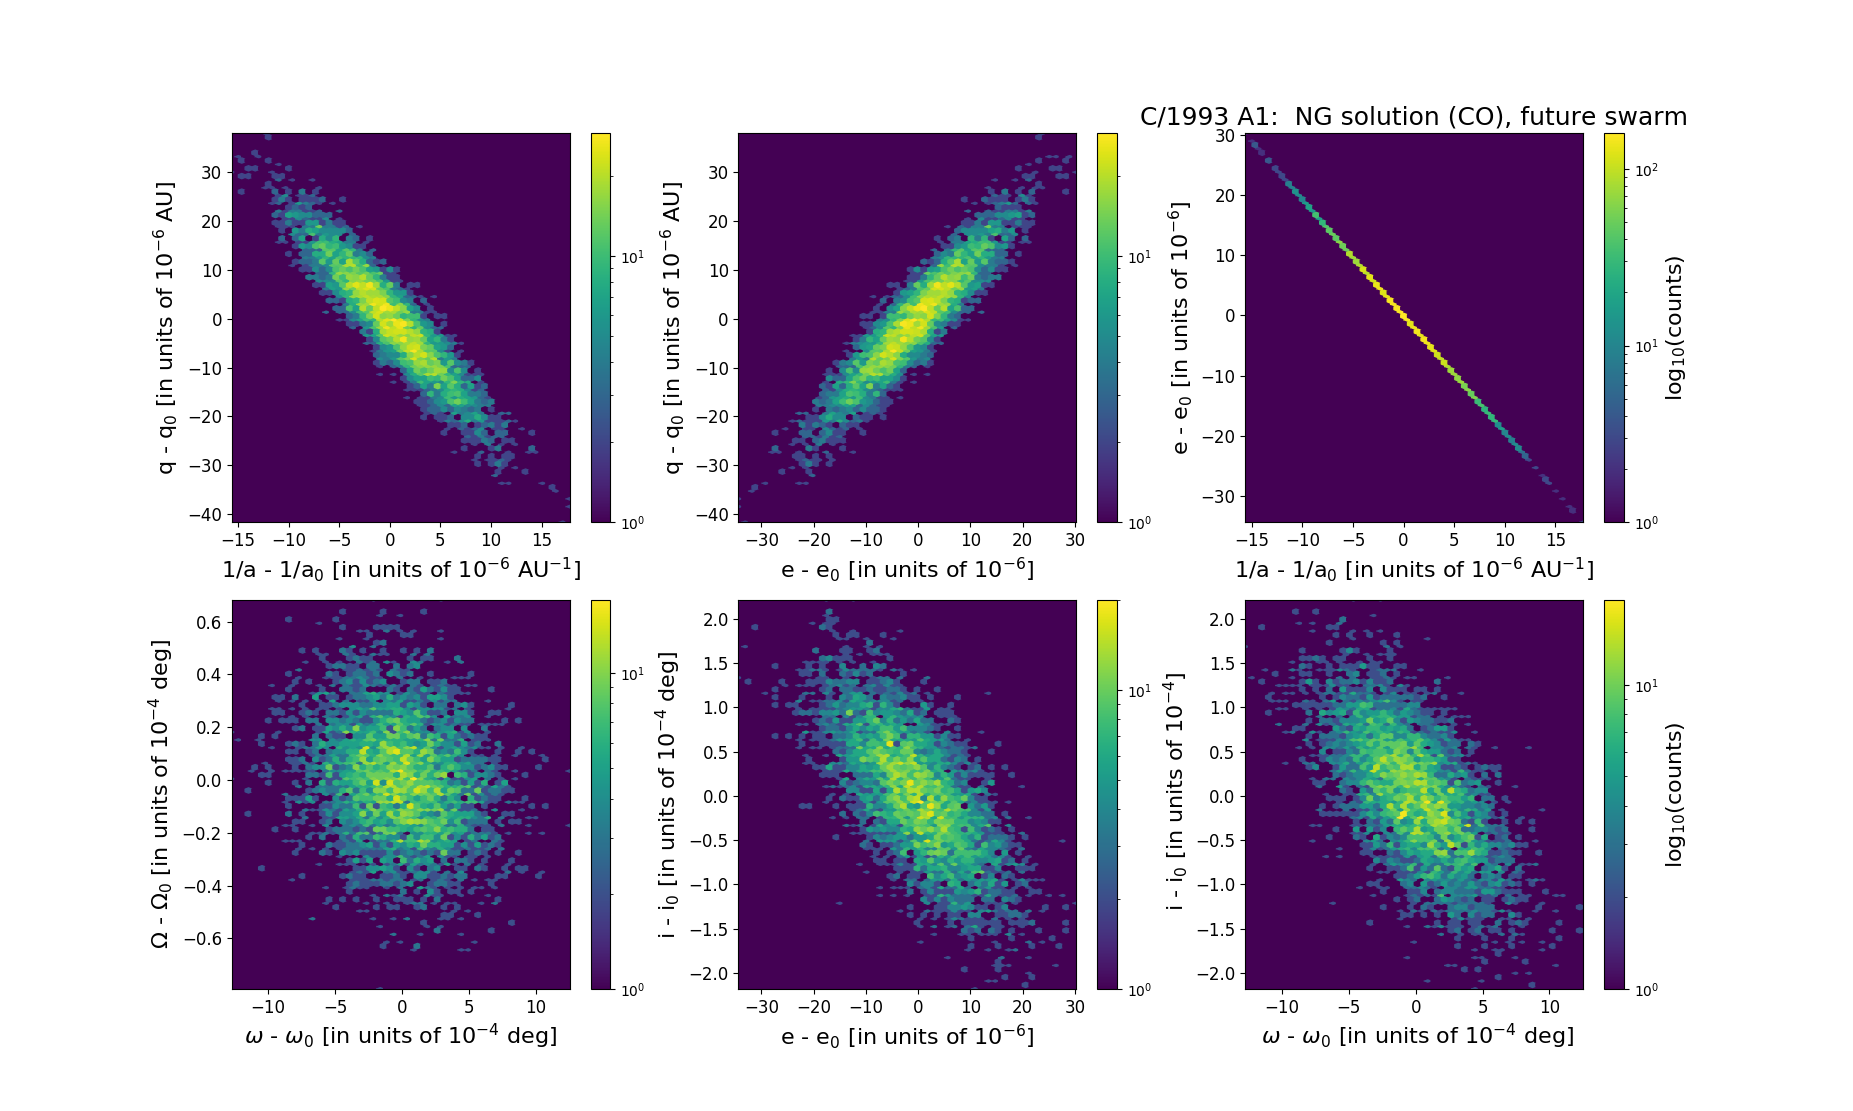
Six 2D-projections of the 6D space of future swarm including 5001 VCs. Each density map is given in logarithmic scale presented on the right in the individual panel.