C/1997 A1 NEAT
more info
Comet C/1997 A1 was discovered by the Near-Earth-Asteroid Tracking Team (cf. IAUC 6341), on images obtained by the on-site USAF/Ground-based Electro-Optical Deep Space Surveillance Team in Hawaii (IAUC 6532). A day later, two preperihelion measurements from 9 January were announced by Kobayashi (IAUC 6534). Then the comet was more than 5 months before its perihelion passage. C/1997 A1 was last seen on 28 December 1997.
The comet made its closest approach to the Earth on 5 February 1997 (2.44 au), that was one month after discovery and 4.5 months before perihelion passage.
Solution given here is based on data spanning over 0.97 yr in a narrow range of heliocentric distances: 3.52 au – 3.16 au (perihelion) – 3.65 au.
This Oort spike comet suffers rather small planetary perturbations during its passage through the planetary system that lead to escape of the comet from the solar system (see future barycentric orbit).
See also Królikowska 2014 and Królikowska and Dybczyński 2017.
| solution description | ||
|---|---|---|
| number of observations | 204 | |
| data interval | 1997 01 09 – 1997 12 28 | |
| data type | perihelion within the observation arc (FULL) | |
| data arc selection | entire data set (STD) | |
| range of heliocentric distances | 3.52 au – 3.16 au (perihelion) – 3.65 au | |
| detectability of NG effects in the comet's motion | NG effects not determinable | |
| type of model of motion | GR - gravitational orbit | |
| data weighting | YES | |
| number of residuals | 400 | |
| RMS [arcseconds] | 0.55 | |
| orbit quality class | 1b | |
| orbital elements (barycentric ecliptic J2000) | ||
|---|---|---|
| Epoch | 1695 04 05 | |
| perihelion date | 1997 06 20.16949500 | ± 0.00051900 |
| perihelion distance [au] | 3.16326982 | ± 0.00000236 |
| eccentricity | 0.99993098 | ± 0.00000519 |
| argument of perihelion [°] | 40.022006 | ± 0.000115 |
| ascending node [°] | 135.720211 | ± 0.000018 |
| inclination [°] | 145.046895 | ± 0.000027 |
| reciprocal semi-major axis [10-6 au-1] | 21.82 | ± 1.64 |
| file containing 5001 VCs swarm |
|---|
| 1997a1a5.bmi |
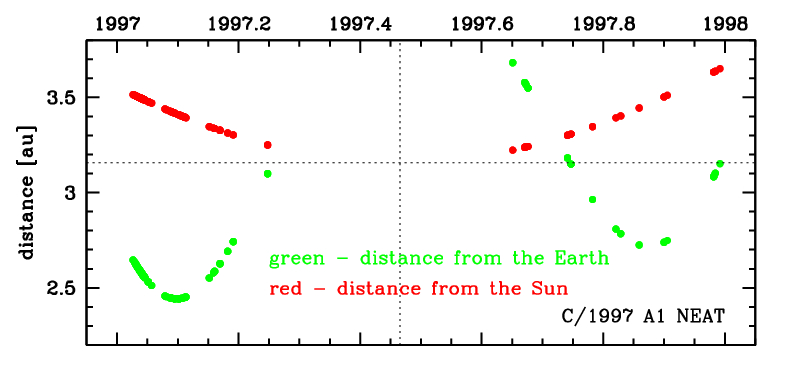
Time distribution of positional observations with corresponding heliocentric (red curve) and geocentric (green curve) distance at which they were taken. The horizontal dotted line shows the perihelion distance for a given comet whereas vertical dotted line — the moment of perihelion passage.
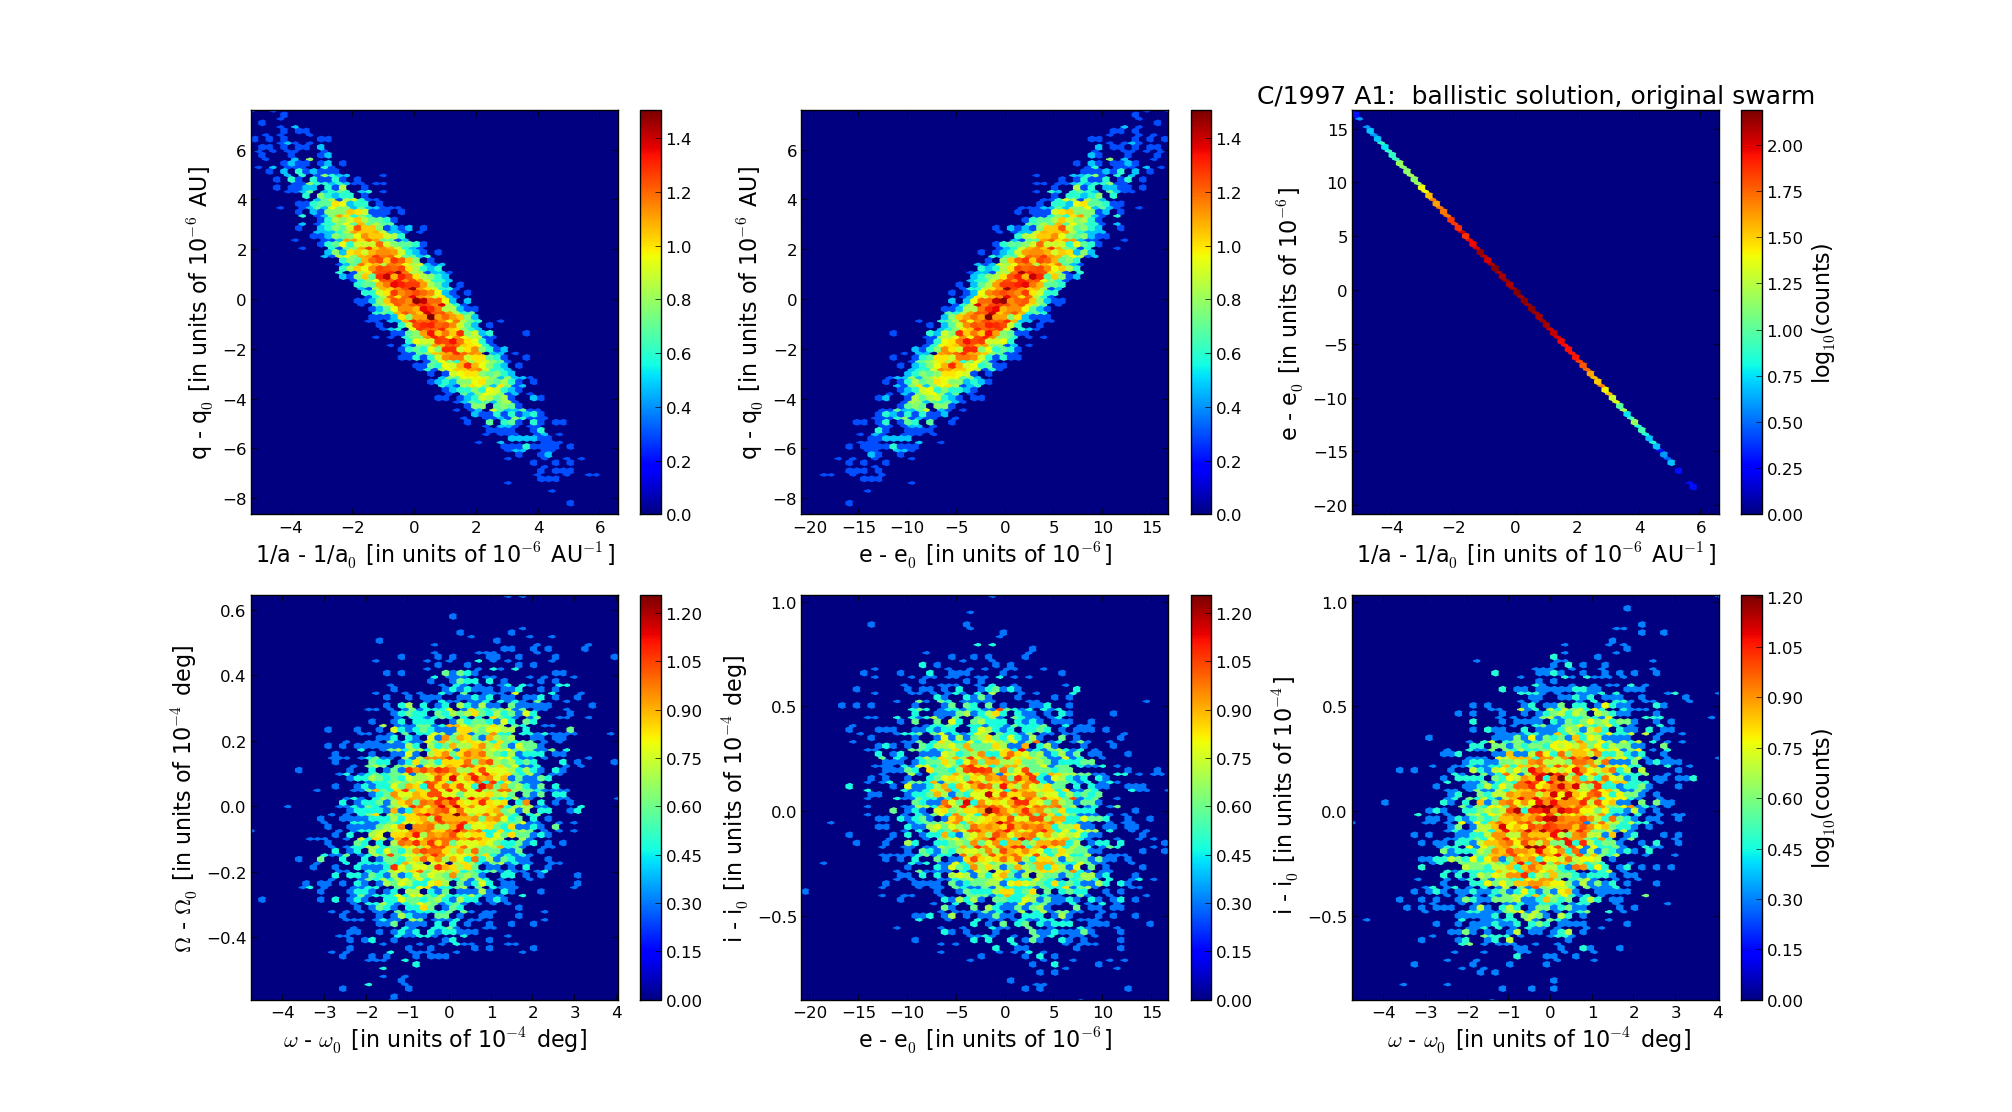
Six 2D-projections of the 6D space of original swarm including 5001 VCs. Each density map is given in logarithmic scale presented on the right in the individual panel.