C/1997 BA6 Spacewatch
more info
Comet C/1997 BA6 was discovered as an asteroidal object by the Spacewatch program on 31 January 1997 (with also prediscovery images on January 11) (IAUC 6561). In February, two independent groups on the basis of exposures with 2.4-m Hiltner Telescope at Kitt Peak and 2.2-m telescope on Mauna Kea detected coma around C/1997 BA6 (IAUC 6561).
At the moment of discovery the comet was almost three years before its perihelion passage. C/1997 BA6 was last seen on 15 September 2004.
The comet made its closest approach to the Earth on 27 July 2000 (3.21 au), that was eight months after perihelion passage, however in the previous opposition it was within 3.66 au on 20 March 1999 (about seven months before perihelion).
Solutions given here is based on data span over 7.68 yr in the range of heliocentric distances: 9.15 au – 3.44 au (perihelion) – 13.39 au.
NG orbits using full data-arc as well as independently using pre-perihelion and post-perihelion data are determinable.
See also Królikowska and Dones 2023, Królikowska and Dybczyński 2017,and Królikowska 2014.
| solution description | ||
|---|---|---|
| number of observations | 529 | |
| data interval | 1997 01 11 – 2004 09 15 | |
| data type | perihelion within the observation arc (FULL) | |
| data arc selection | entire data set (STD) | |
| range of heliocentric distances | 9.15 au – 3.44 au (perihelion) – 13.4 au | |
| type of model of motion | NS - non-gravitational orbits for standard g(r) | |
| data weighting | NO | |
| number of residuals | 1054 | |
| RMS [arcseconds] | 0.67 | |
| orbit quality class | 1a+ | |
| previous orbit statistics, both Galactic and stellar perturbations were taken into account | ||
|---|---|---|
| no. of returning VCs in the swarm | 5001 | * |
| no. of escaping VCs in the swarm | 0 | |
| no. of hyperbolas among escaping VCs in the swarm | 0 | |
| previous reciprocal semi-major axis [10-6 au-1] | 29.14 – 30.74 – 32.31 | |
| previous perihelion distance [au] | 637 – 690 – 732 | |
| previous aphelion distance [103 au] | 61.3 – 64.4 – 67.9 | |
| time interval to previous perihelion [Myr] | 5.42 – 5.82 – 6.29 | |
| percentage of VCs with qprev > 20 | 100 | |
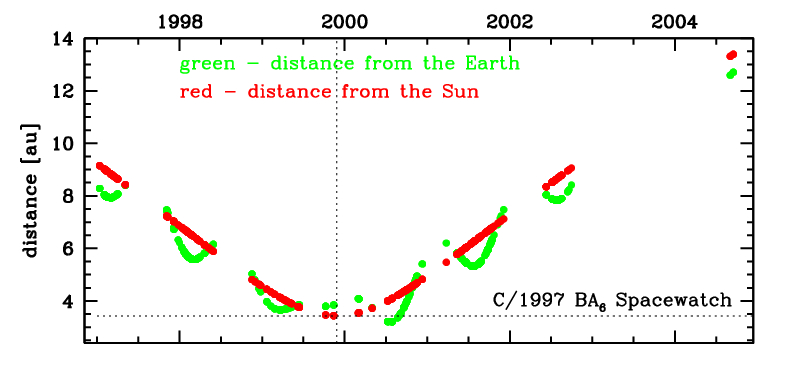
Time distribution of positional observations with corresponding heliocentric (red curve) and geocentric (green curve) distance at which they were taken. The horizontal dotted line shows the perihelion distance for a given comet whereas vertical dotted line — the moment of perihelion passage.
| previous_g orbit statistics, here only the Galactic tide has been included | ||
|---|---|---|
| no. of returning VCs in the swarm | 5001 | * |
| no. of escaping VCs in the swarm | 0 | |
| no. of hyperbolas among escaping VCs in the swarm | 0 | |
| previous reciprocal semi-major axis [10-6 au-1] | 30.36 – 31.85 – 33.29 | |
| previous perihelion distance [au] | 16 – 20 – 25 | |
| previous aphelion distance [103 au] | 60.1 – 62.8 – 65.9 | |
| time interval to previous perihelion [Myr] | 5.15 – 5.5 – 5.9 | |
| percentage of VCs with 10 < qprev < 20 | 55 | |
| percentage of VCs with qprev > 20 | 45 | |