C/1997 J2 Meunier-Dupouy
more info
Comet C/1997 J2 was discovered on 7 May 1997 by Michel Meunier (Arbonne la Foret, France) during the observation of comet C/1997 J1 Mueller.Independently, this comet was detected on 8 May by Philippe Dupouy (Observatoire de Dax, France). A day after, Jean Mueller found this comet on the image taken on 5 May (Mount Palomar Observatory)where she discovered C/1997 J1. At the moment of discovery, C/1997 J2 was about 10 months before its perihelion passage and it was last observed in October 1999.
Comet had its closest approach to the Earth on 14 August 1998 (2.492 au), about 5 months after its perihelion passage.
This is a comet with nongravitational effects strongly manifested in positional data fitting.
Solutions given here are based on data spanning over 2.43 yr in a range of heliocentric distances: 4.24 au – 3.05 au (perihelion) – 6.06 au.It is difficult to indicate the preffered non-gravitational orbit and worth noting is also the solution based on g(r)-like formula describing the CO sublimation (solution c1).
This Oort spike comet suffers tiny planetary perturbations during its passage through the planetary system; these perturbations lead to a slightly less tight future orbit.
See also Królikowska 2014 and Królikowska 2020.
| solution description | ||
|---|---|---|
| number of observations | 1446 | |
| data interval | 1997 05 05 – 1999 10 09 | |
| data type | perihelion within the observation arc (FULL) | |
| data arc selection | entire data set (STD) | |
| range of heliocentric distances | 4.24 au – 3.05 au (perihelion) – 6.06 au | |
| type of model of motion | NS - non-gravitational orbits for standard g(r) | |
| data weighting | YES | |
| number of residuals | 2863 | |
| RMS [arcseconds] | 0.53 | |
| orbit quality class | 1a+ | |
| orbital elements (barycentric ecliptic J2000) | ||
|---|---|---|
| Epoch | 2300 02 13 | |
| perihelion date | 1998 03 11.76761209 | ± 0.00029195 |
| perihelion distance [au] | 3.03930973 | ± 0.00000170 |
| eccentricity | 0.99995526 | ± 0.00000277 |
| argument of perihelion [°] | 122.507863 | ± 0.000075 |
| ascending node [°] | 148.804024 | ± 0.000006 |
| inclination [°] | 91.25322 | ± 0.000005 |
| reciprocal semi-major axis [10-6 au-1] | 14.72 | ± 0.91 |
| file containing 5001 VCs swarm |
|---|
| 1997j2n1.bpl |
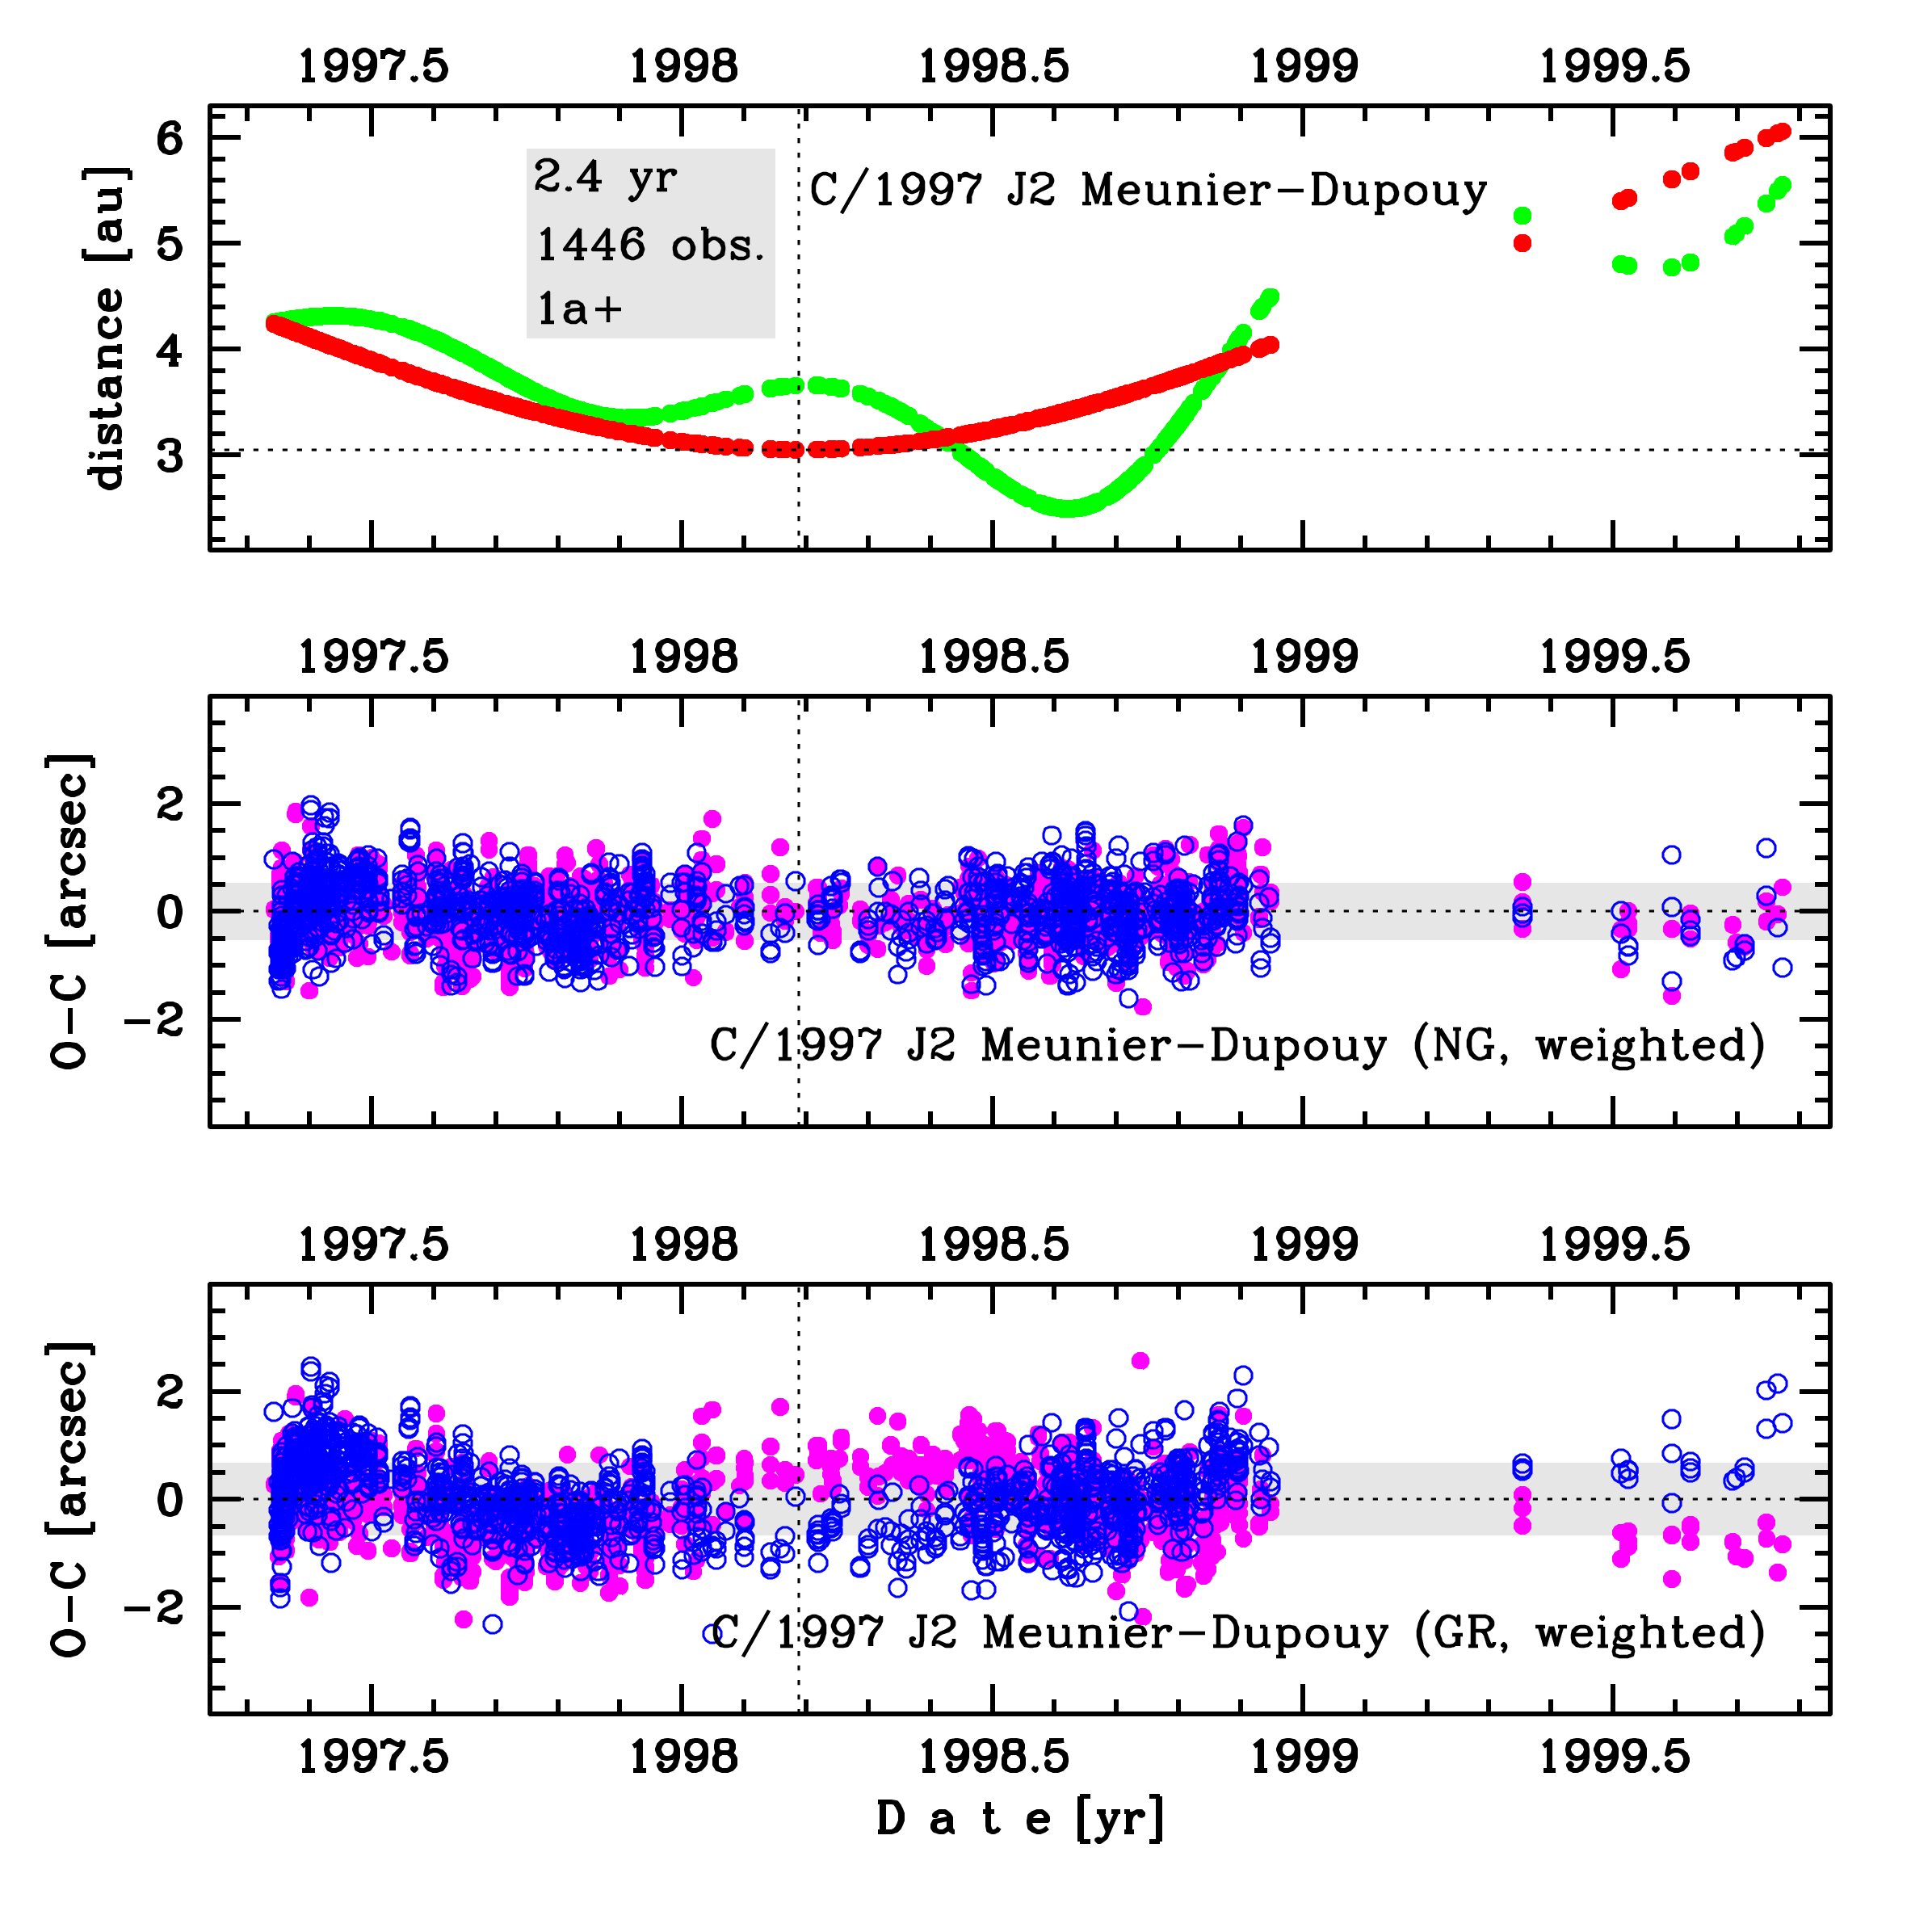
Upper panel: Time distribution of positional observations with corresponding heliocentric (red curve) and geocentric (green curve) distance at which they were taken. The horizontal dotted line shows the perihelion distance for a given comet whereas vertical dotted line — the moment of perihelion passage.
Lower panel (panels): O-C diagram for this(two) solution (solutions) given in this database, where residuals in right ascension are shown using magenta dots and in declination by blue open circles.
Lower panel (panels): O-C diagram for this(two) solution (solutions) given in this database, where residuals in right ascension are shown using magenta dots and in declination by blue open circles.
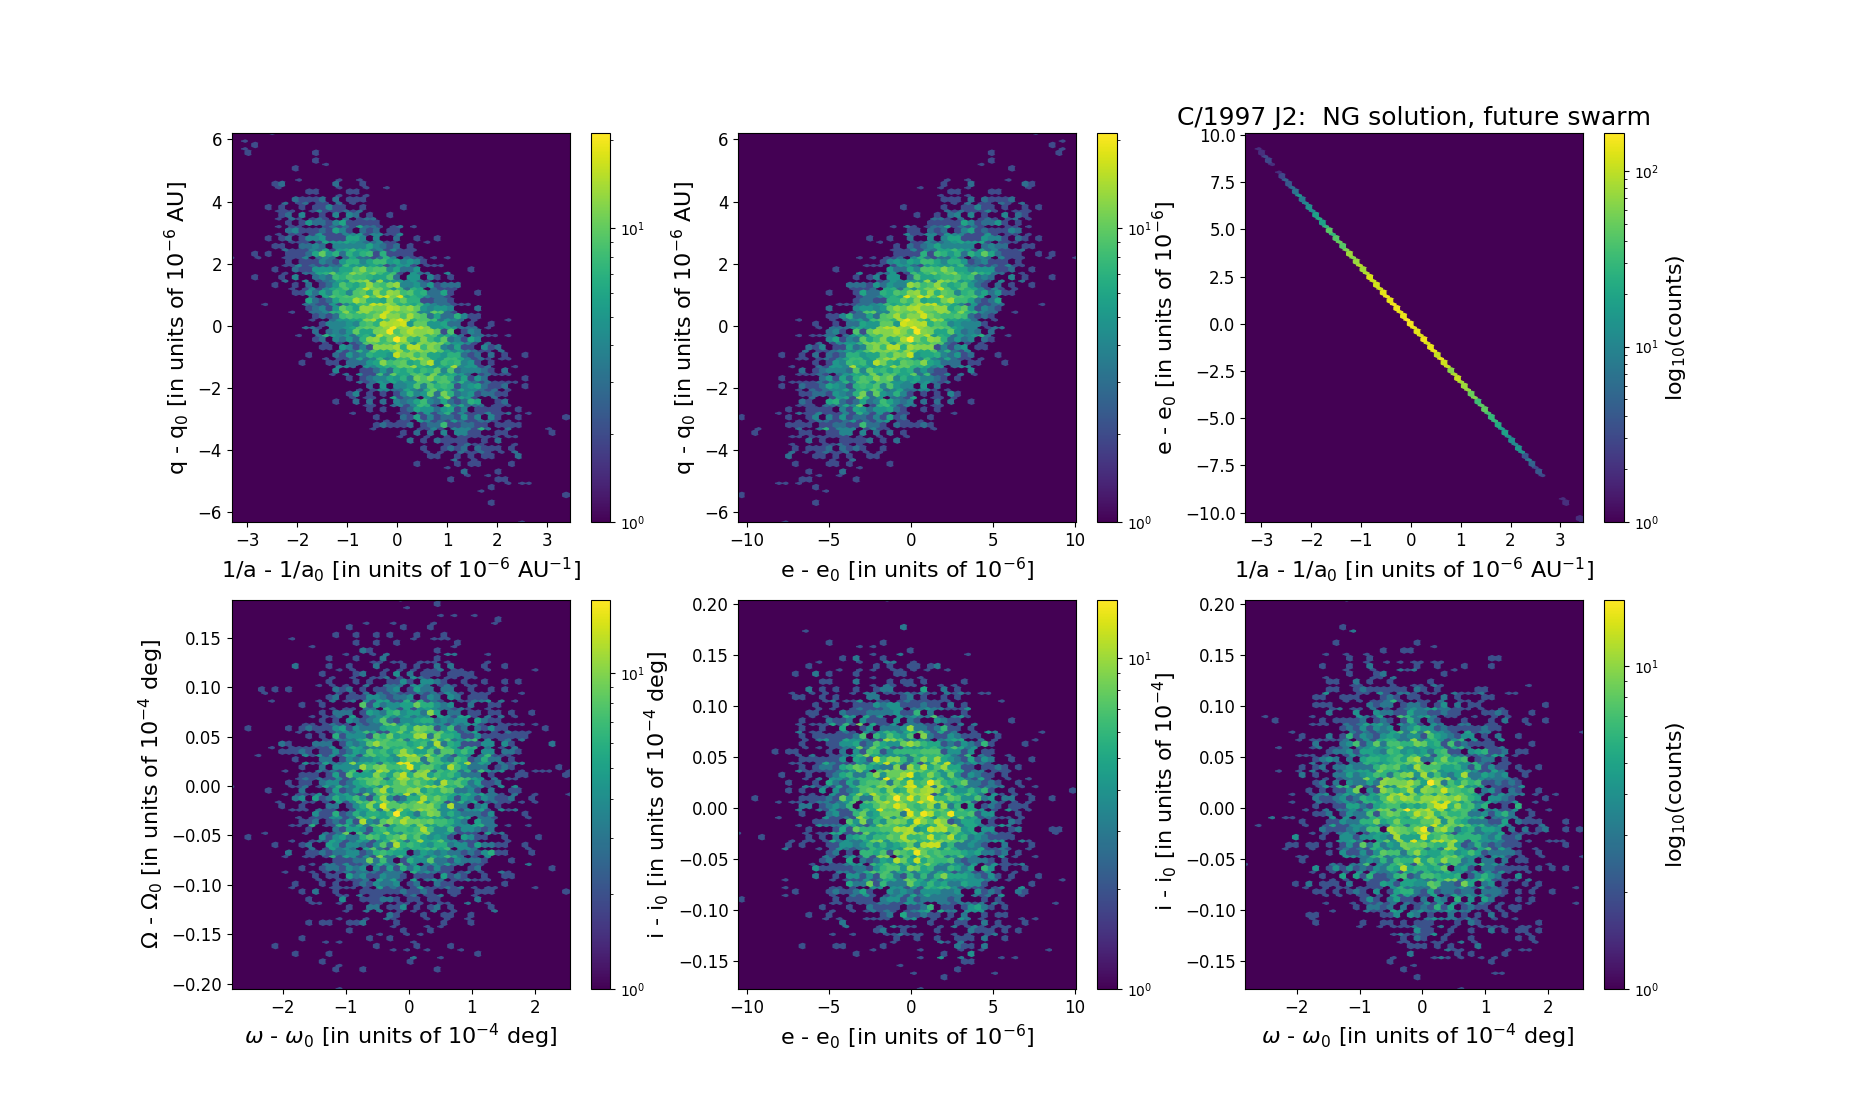
Six 2D-projections of the 6D space of future swarm including 5001 VCs. Each density map is given in logarithmic scale presented on the right in the individual panel.