C/1999 K5 LINEAR
more info
C/1999 K5 was discovered as an apparently asteroidal object by LINEAR team on 20 May 1999 (1.1 yr before perihelion passage), and soon reported as cometary by several observers. Later pre-discovery detection from 15 May 1999 by 2MASS was found.
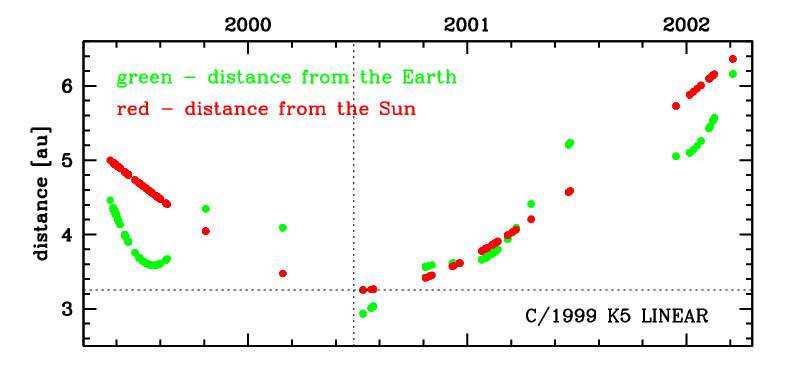
This comet made its closest approach to the Earth on 18 June 2000 (2.885 au), 16 days before perihelion.
Solution given here is based on data spanning over 2.8 yr in a range of heliocentric distances: 5.00 au – 3.255 au (perihelion) – 6.36 au.
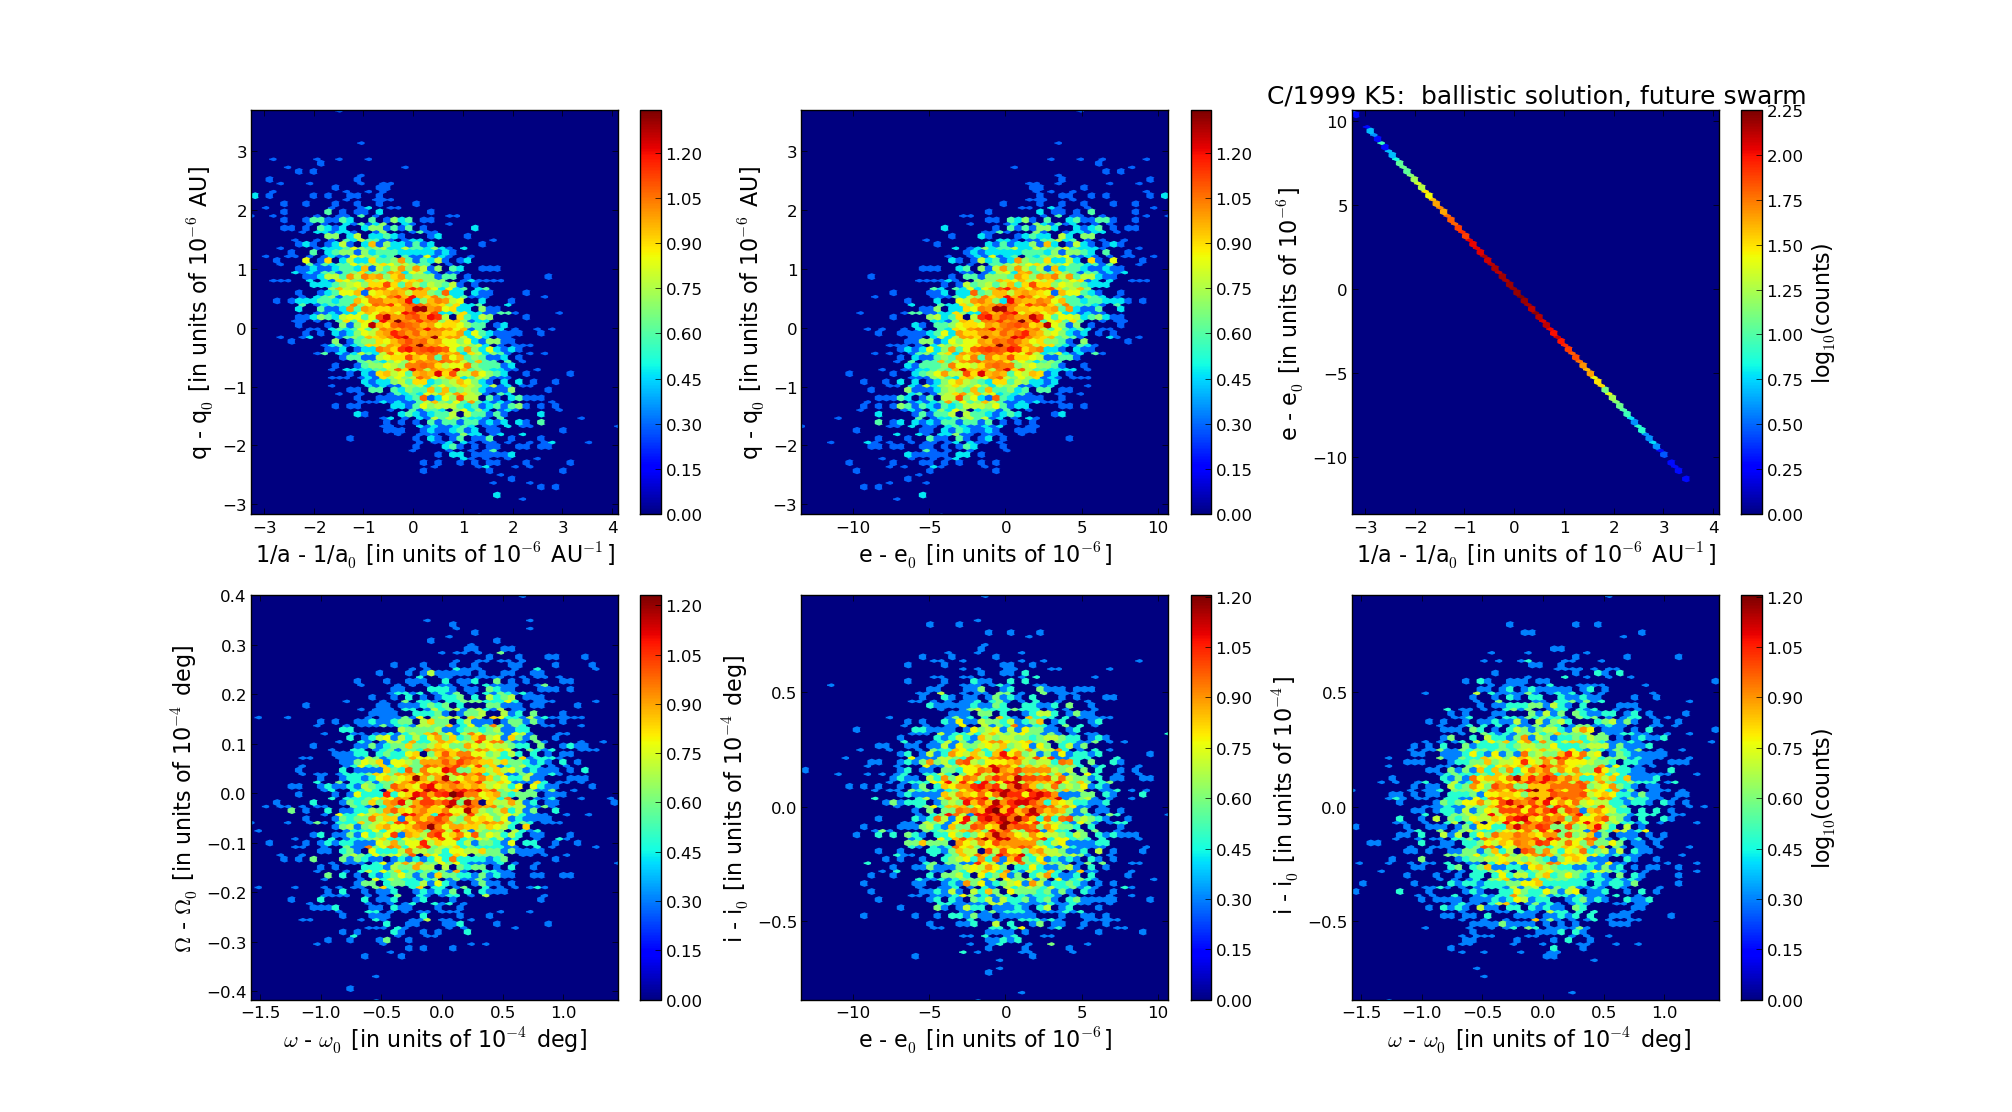
This Oort spike comet suffers moderate planetary perturbations during its passage through the planetary system that lead to notable more tight future orbit (see future barycentric orbit).
See also Królikowska 2014 and Królikowska and Dybczyński 2017.
| solution description | ||
|---|---|---|
| number of observations | 250 | |
| data interval | 1999 05 15 – 2002 03 18 | |
| data type | perihelion within the observation arc (FULL) | |
| data arc selection | entire data set (STD) | |
| range of heliocentric distances | 5 au – 3.25 au (perihelion) – 6.36 au | |
| detectability of NG effects in the comet's motion | NG effects not determinable | |
| type of model of motion | GR - gravitational orbit | |
| data weighting | YES | |
| number of residuals | 492 | |
| RMS [arcseconds] | 0.51 | |
| orbit quality class | 1a+ | |
| orbital elements (barycentric ecliptic J2000) | ||
|---|---|---|
| Epoch | 2307 02 17 | |
| perihelion date | 2000 07 04.01384700 | ± 0.00032600 |
| perihelion distance [au] | 3.26343066 | ± 0.00000093 |
| eccentricity | 0.99874785 | ± 0.00000310 |
| argument of perihelion [°] | 241.555903 | ± 0.000043 |
| ascending node [°] | 106.352565 | ± 0.000011 |
| inclination [°] | 89.570567 | ± 0.000024 |
| reciprocal semi-major axis [10-6 au-1] | 383.69 | ± 0.95 |
| file containing 5001 VCs swarm |
|---|
| 1999k5a2.bpl |

