C/1999 N4 LINEAR
more info
C/1999 N4 was discovered as an apparently asteroidal object by LINEAR team on 12 July 1999 (ten months before perihelion passage), and soon reported as cometary by observers [IAUC 7226, 1999 July 17]. Later, pre-discovery detection from 27 August 1998 by LINEAR was found.
This comet made its closest approach to the Earth on 4 June 2000 (4.589 au), twelve days after perihelion.
Solutions given here are based on data spanning over 3.7 yr in a range of heliocentric distances: 7.14 au – 5.505 au (perihelion) – 7.49 au.
NG orbit is possible to obtained using the full data arc; however uncertainties of NG parameters are notable, especially for A2 (see solutions ac and bc differing only in data weighting).
This Oort spike comet suffered slight planetary perturbations during its passage through the planetary system.
See also Królikowska and Dones 2023, Królikowska and Dybczyński 2017,and Królikowska 2014.
| solution description | ||
|---|---|---|
| number of observations | 345 | |
| data interval | 1998 08 27 – 2002 05 06 | |
| data type | perihelion within the observation arc (FULL) | |
| data arc selection | entire data set (STD) | |
| range of heliocentric distances | 7.14 au – 5.50 au (perihelion) – 7.49 au | |
| detectability of NG effects in the comet's motion | comet with determinable NG~orbit | |
| type of model of motion | GR - gravitational orbit | |
| data weighting | YES | |
| number of residuals | 661 | |
| RMS [arcseconds] | 0.53 | |
| orbit quality class | 1a | |
| orbital elements (barycentric ecliptic J2000) | ||
|---|---|---|
| Epoch | 2306 09 10 | |
| perihelion date | 2000 05 22.05815747 | ± 0.00084949 |
| perihelion distance [au] | 5.51244642 | ± 0.00000630 |
| eccentricity | 0.99985465 | ± 0.00000787 |
| argument of perihelion [°] | 90.432807 | ± 0.000099 |
| ascending node [°] | 345.955755 | ± 0.000046 |
| inclination [°] | 156.948399 | ± 0.000009 |
| reciprocal semi-major axis [10-6 au-1] | 26.37 | ± 1.43 |
| file containing 5001 VCs swarm |
|---|
| 1999n4a5.bpl |
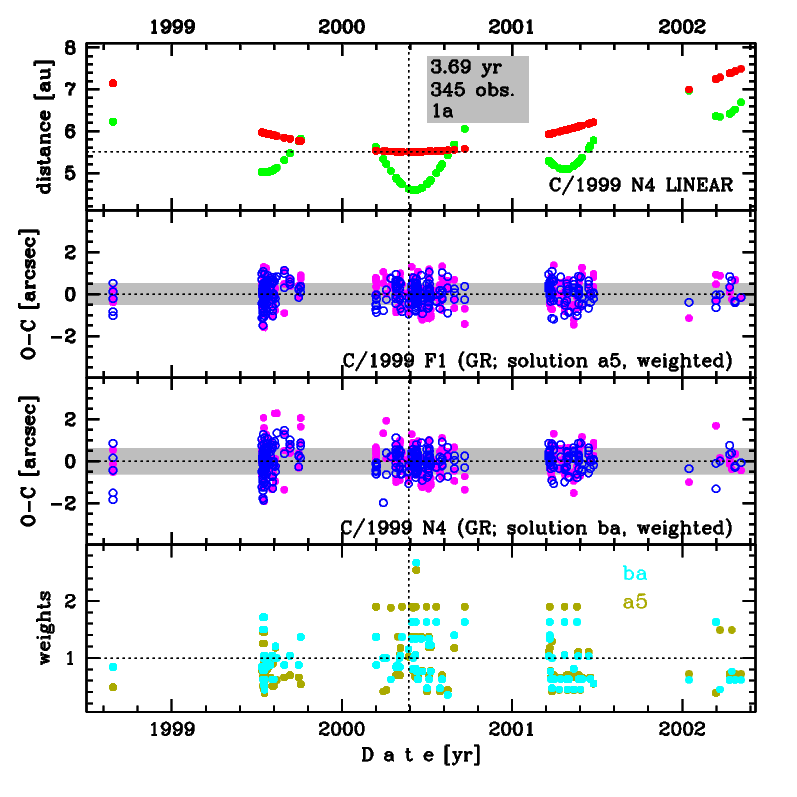
Upper panel: Time distribution of positional observations with corresponding heliocentric (red curve) and geocentric (green curve) distance at which they were taken. The horizontal dotted line shows the perihelion distance for a given comet whereas vertical dotted line — the moment of perihelion passage.
Middle panel(s): O-C diagram for a given solution (sometimes in comparison to another solution available in CODE), where residuals in right ascension are shown using magenta dots and in declination by blue open circles.
Lowest panel: Relative weights for a given data set(s).
Middle panel(s): O-C diagram for a given solution (sometimes in comparison to another solution available in CODE), where residuals in right ascension are shown using magenta dots and in declination by blue open circles.
Lowest panel: Relative weights for a given data set(s).
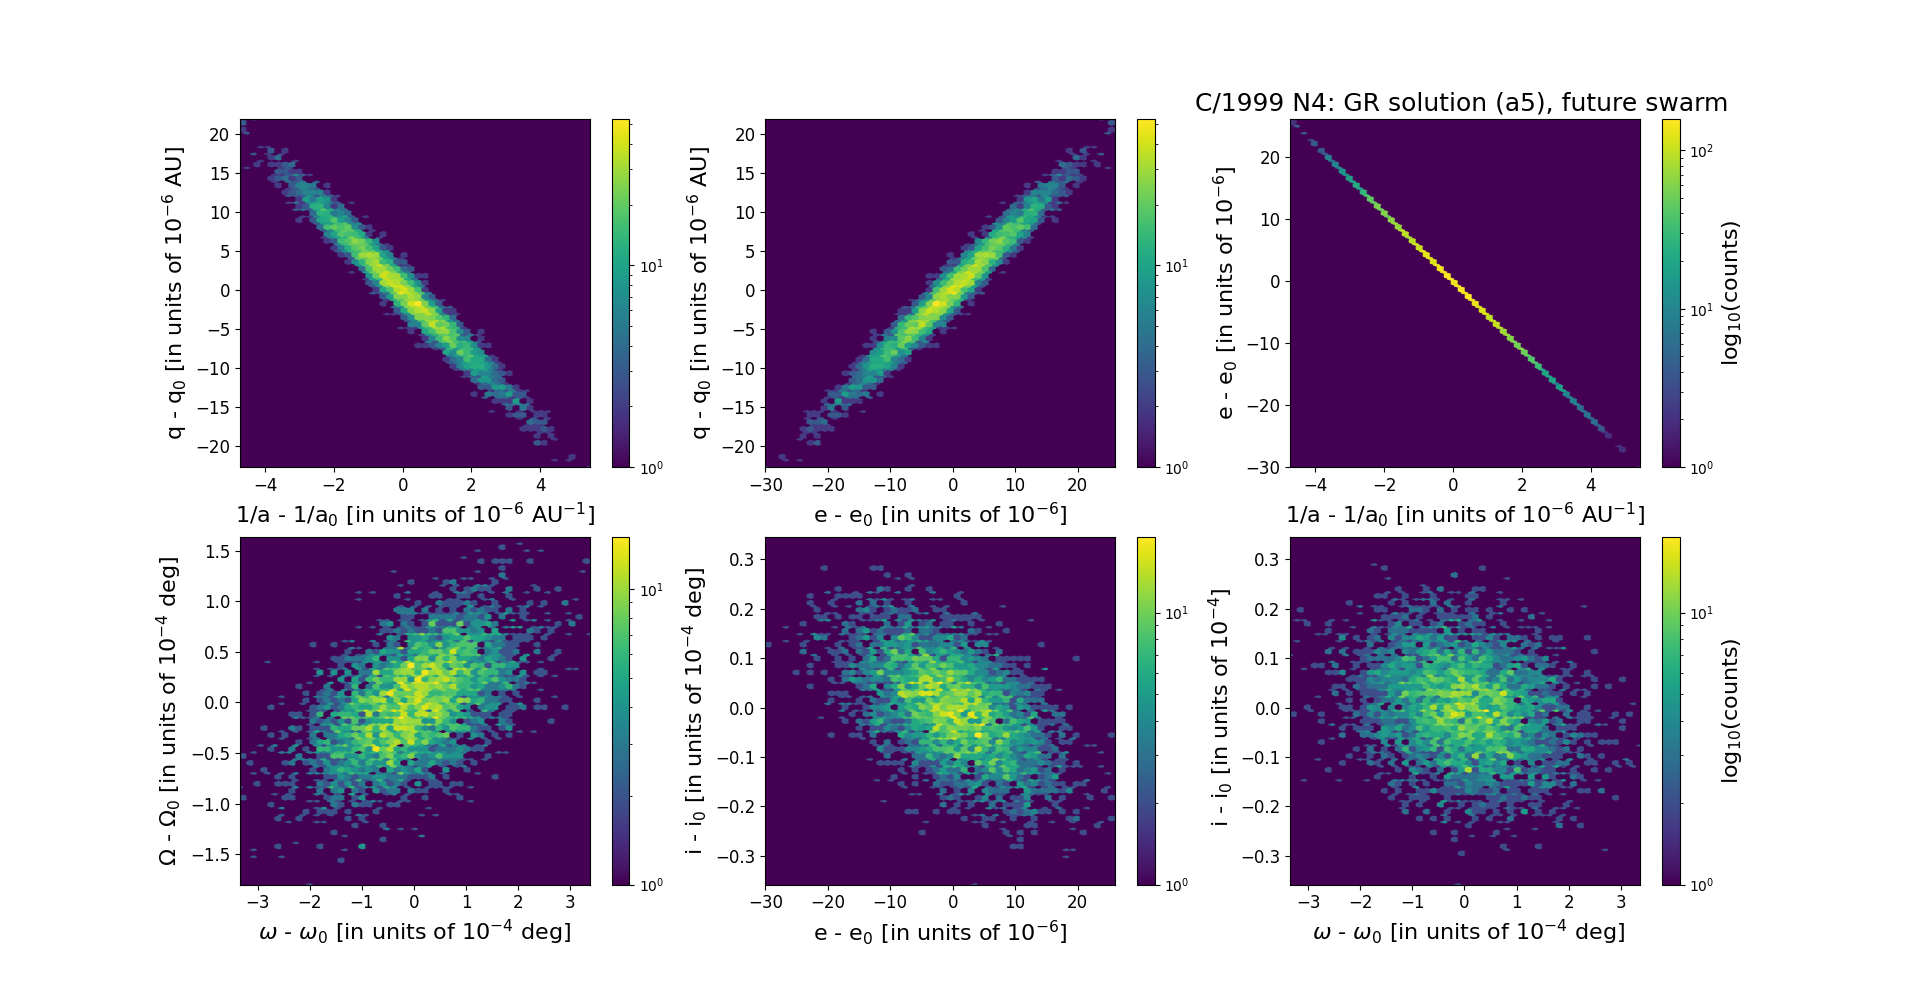
Six 2D-projections of the 6D space of future swarm including 5001 VCs. Each density map is given in logarithmic scale presented on the right in the individual panel.