C/1999 U4 Catalina-Skiff
more info
C/1999 U4 was discovered on 31 October 1999 by the Catalina Sky Survey, and, independently, on 1 November by B.A. Skiff under LONEOS Survey. At once, its cometary apperance was reported [IAUC 7298, 1999 November 1]. Later, pre-discovery detections from 18 September and 30 October 1999 were found.
This comet made its closest approach to the Earth on 11 January 2002 (4.415 au), 2.5 months after perihelion.
Solutions given here are based on data spanning over 4.6 yr in a range of heliocentric distances: 7.55 au – 4.915 au (perihelion) – 8.22 au; NG~orbits are determinable.
NG orbit using full data-arc is determinable.
This Oort spike comet suffered moderate planetary perturbations during its passage through the planetary system that lead to escape of the comet from the solar system on hiperbolic orbit (see future barycentric orbit).
See also Królikowska and Dones 2023, Królikowska and Dybczyński 2017,and Królikowska 2014.
| solution description | ||
|---|---|---|
| number of observations | 911 | |
| data interval | 1999 09 18 – 2004 04 11 | |
| data type | perihelion within the observation arc (FULL) | |
| data arc selection | entire data set (STD) | |
| range of heliocentric distances | 7.55 au – 4.92 au (perihelion) – 8.22 au | |
| type of model of motion | NC - non-gravitational orbits for symmetric CO-g(r)-like function | |
| data weighting | YES | |
| number of residuals | 1807 | |
| RMS [arcseconds] | 0.75 | |
| orbit quality class | 1a+ | |
| orbital elements (barycentric ecliptic J2000) | ||
|---|---|---|
| Epoch | 1696 06 18 | |
| perihelion date | 2001 10 29.94668587 | ± 0.00083005 |
| perihelion distance [au] | 4.88667571 | ± 0.00000507 |
| eccentricity | 0.99981615 | ± 0.00000574 |
| argument of perihelion [°] | 77.830403 | ± 0.000113 |
| ascending node [°] | 32.387486 | ± 0.000013 |
| inclination [°] | 52.060369 | ± 0.000014 |
| reciprocal semi-major axis [10-6 au-1] | 37.62 | ± 1.18 |
| file containing 5001 VCs swarm |
|---|
| 1999u4c2.bmi |

Upper panel: Time distribution of positional observations with corresponding heliocentric (red curve) and geocentric (green curve) distance at which they were taken. The horizontal dotted line shows the perihelion distance for a given comet whereas vertical dotted line — the moment of perihelion passage.
Middle panel(s): O-C diagram for a given solution (sometimes in comparison to another solution available in CODE), where residuals in right ascension are shown using magenta dots and in declination by blue open circles.
Lowest panel: Relative weights for a given data set(s).
Middle panel(s): O-C diagram for a given solution (sometimes in comparison to another solution available in CODE), where residuals in right ascension are shown using magenta dots and in declination by blue open circles.
Lowest panel: Relative weights for a given data set(s).
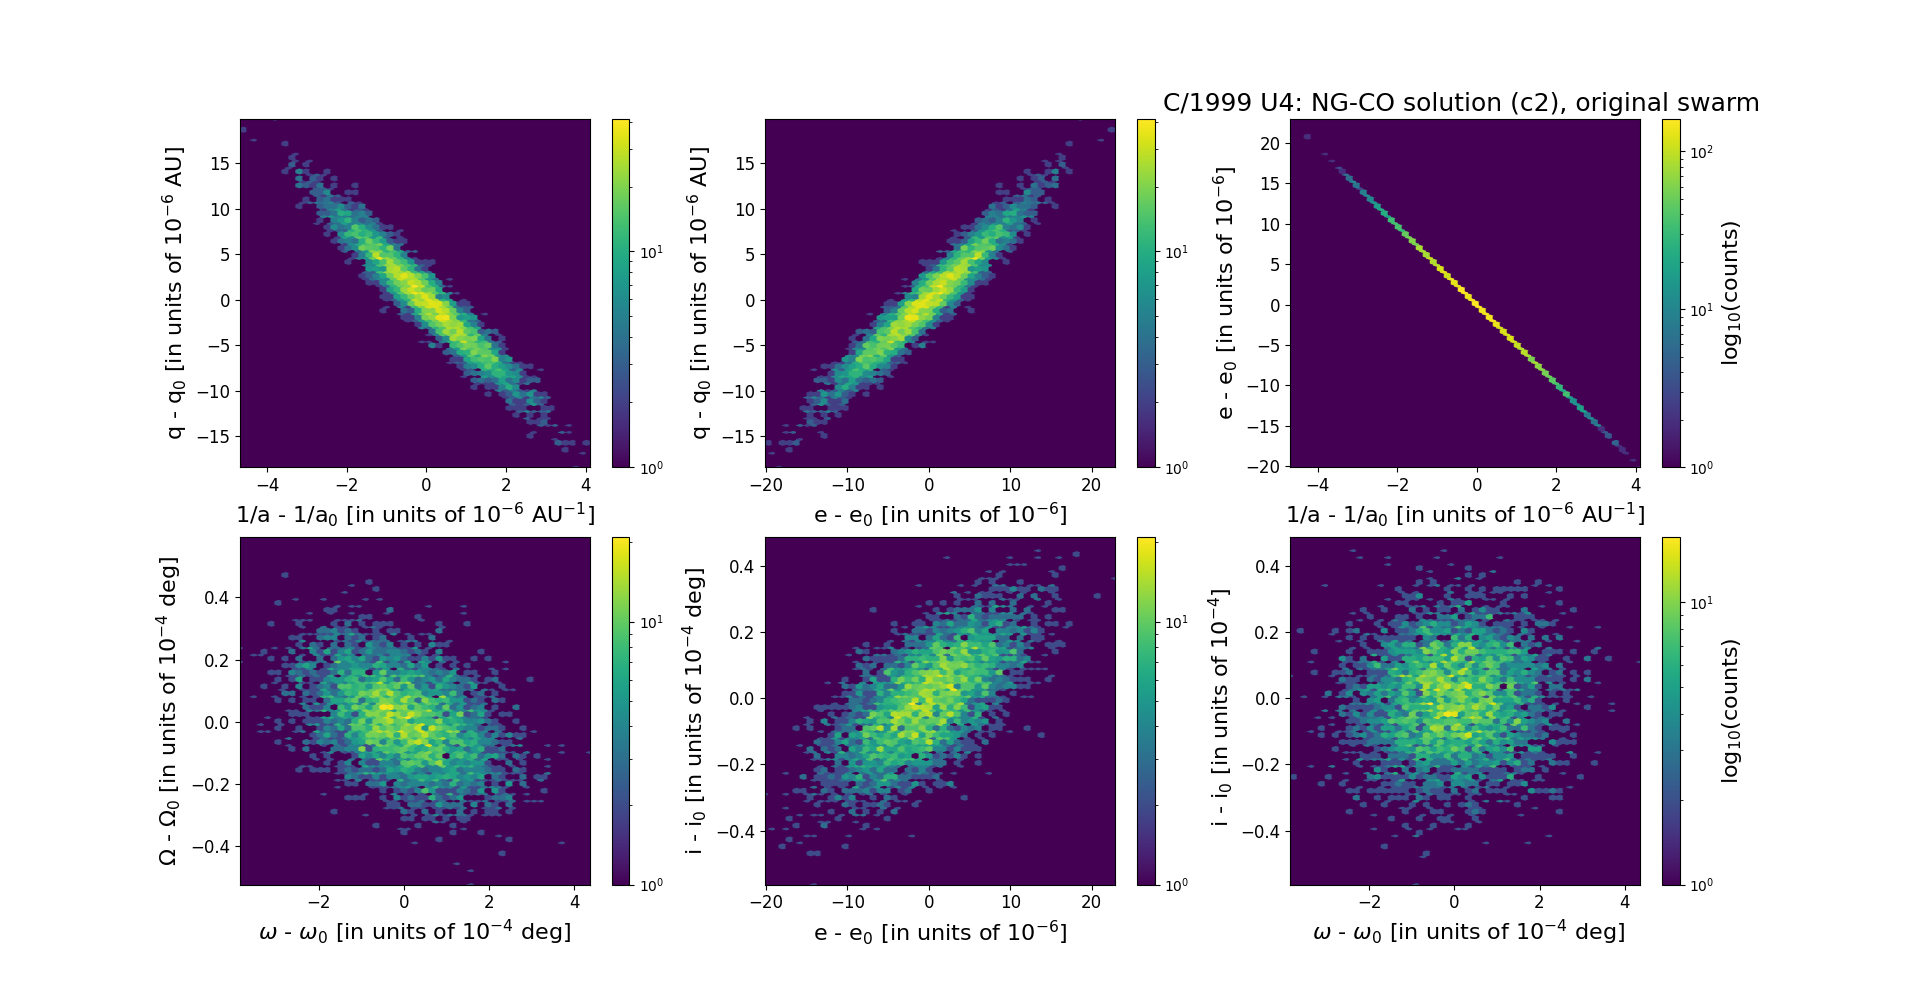
Six 2D-projections of the 6D space of original swarm including 5001 VCs. Each density map is given in logarithmic scale presented on the right in the individual panel.