C/2000 A1 Montani
more info
C/2000 A1 was discovered on 12 January 2000 by J. Montani on CCD images taken using the Spacewatch telescope at Kitt Peak as cometary object [IAUC 7346, 2000 January 14]. After preliminary orbit computations it was found that Spacewatch and LINEAR survey registered this object on pre-discovery images taken 8 and 7 days before.
This comet made its closest approach to the Earth on 20 January 2000 (8.809 au), 5.7 months before perihelion.
Solution given here is based on data spanning over 2.2 yr in a range of heliocentric distances: 9.80 au – 9.743 au (perihelion) – 10.3 au.
This Oort spike comet suffers slight planetary perturbations during its passage through the planetary system.
See also Królikowska 2014 and Królikowska and Dybczyński 2017.
| solution description | ||
|---|---|---|
| number of observations | 132 | |
| data interval | 2000 01 04 – 2002 03 20 | |
| data type | perihelion within the observation arc (FULL) | |
| data arc selection | entire data set (STD) | |
| range of heliocentric distances | 9.8 au – 9.74 au (perihelion) – 10.3 au | |
| detectability of NG effects in the comet's motion | NG effects not determinable | |
| type of model of motion | GR - gravitational orbit | |
| data weighting | YES | |
| number of residuals | 264 | |
| RMS [arcseconds] | 0.45 | |
| orbit quality class | 1a | |
| next orbit statistics, both Galactic and stellar perturbations were taken into account | ||
|---|---|---|
| no. of returning VCs in the swarm | 5001 | * |
| no. of escaping VCs in the swarm | 0 | |
| no. of hyperbolas among escaping VCs in the swarm | 0 | |
| next reciprocal semi-major axis [10-6 au-1] | 71.91 – 74.37 – 76.88 | |
| next perihelion distance [au] | 13 – 16 – 19 | |
| next aphelion distance [103 au] | 26 – 26.9 – 27.8 | |
| time interval to next perihelion [Myr] | 1.48 – 1.55 – 1.64 | |
| percentage of VCs with 10 < qnext < 20 | 93 | |
| percentage of VCs with qnext > 20 | 7 | |
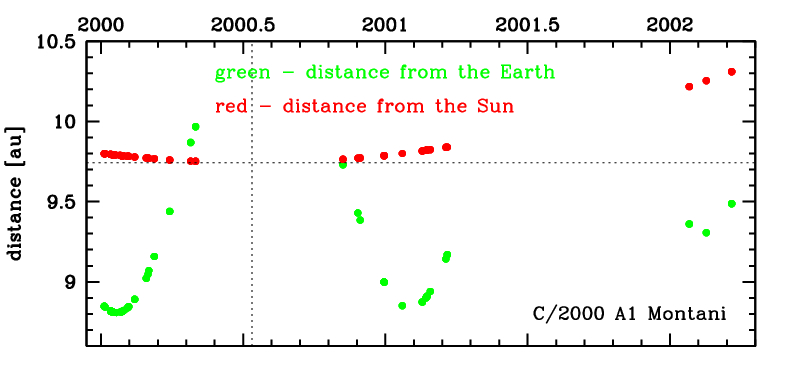
Time distribution of positional observations with corresponding heliocentric (red curve) and geocentric (green curve) distance at which they were taken. The horizontal dotted line shows the perihelion distance for a given comet whereas vertical dotted line — the moment of perihelion passage.
| next_g orbit statistics, here only the Galactic tide has been included | ||
|---|---|---|
| no. of returning VCs in the swarm | 5001 | * |
| no. of escaping VCs in the swarm | 0 | |
| no. of hyperbolas among escaping VCs in the swarm | 0 | |
| next reciprocal semi-major axis [10-6 au-1] | 71.95 – 74.45 – 77.04 | |
| next perihelion distance [au] | 8.15 – 8.32 – 8.47 | |
| next aphelion distance [103 au] | 26 – 26.9 – 27.8 | |
| time interval to next perihelion [Myr] | 1.48 – 1.55 – 1.64 | |
| percentage of VCs with qnext < 10 | 100 | |