C/2000 CT54 LINEAR
more info
C/2000 CT54 was discovered on 2 February 2000 by LINEAR Survey as apparently asteroidal object. At once, its cometary apperance was reported [IAUC 7368, 2000 February 18]. Later, pre-discovery detections from 28 January 2000 (LINEAR data) and 21 March 1999 (Sloan Digital Sky Survey) were found.
This comet made its closest approach to Earth on 29 July 2001 (2.606 au), 40 days after perihelion.
Non-gravitational solution is based on data span over 4.8 yr in a range of heliocentric distances: 7.72 au – 3.156 au (perihelion) – 8.52 au.
See also Królikowska and Dones 2023, Królikowska and Dybczyński 2017,and Królikowska 2014.
| solution description | ||
|---|---|---|
| number of observations | 210 | |
| data interval | 1999 03 21 – 2004 01 17 | |
| data type | perihelion within the observation arc (FULL) | |
| data arc selection | entire data set (STD) | |
| range of heliocentric distances | 7.72 au – 3.16 au (perihelion) – 8.52 au | |
| type of model of motion | NS - non-gravitational orbits for standard g(r) | |
| data weighting | YES | |
| number of residuals | 417 | |
| RMS [arcseconds] | 0.75 | |
| orbit quality class | 1a+ | |
| next orbit statistics, both Galactic and stellar perturbations were taken into account | ||
|---|---|---|
| no. of returning VCs in the swarm | 5001 | * |
| no. of escaping VCs in the swarm | 0 | |
| no. of hyperbolas among escaping VCs in the swarm | 0 | |
| next reciprocal semi-major axis [10-6 au-1] | 582.18 – 585.31 – 588.55 | |
| next perihelion distance [au] | 3.1562 – 3.15623 – 3.15626 | |
| next aphelion distance [103 au] | 3.395 – 3.414 – 3.432 | |
| time interval to next perihelion [Myr] | 0.06969 – 0.07027 – 0.07083 | |
| percentage of VCs with qnext < 10 | 100 | |
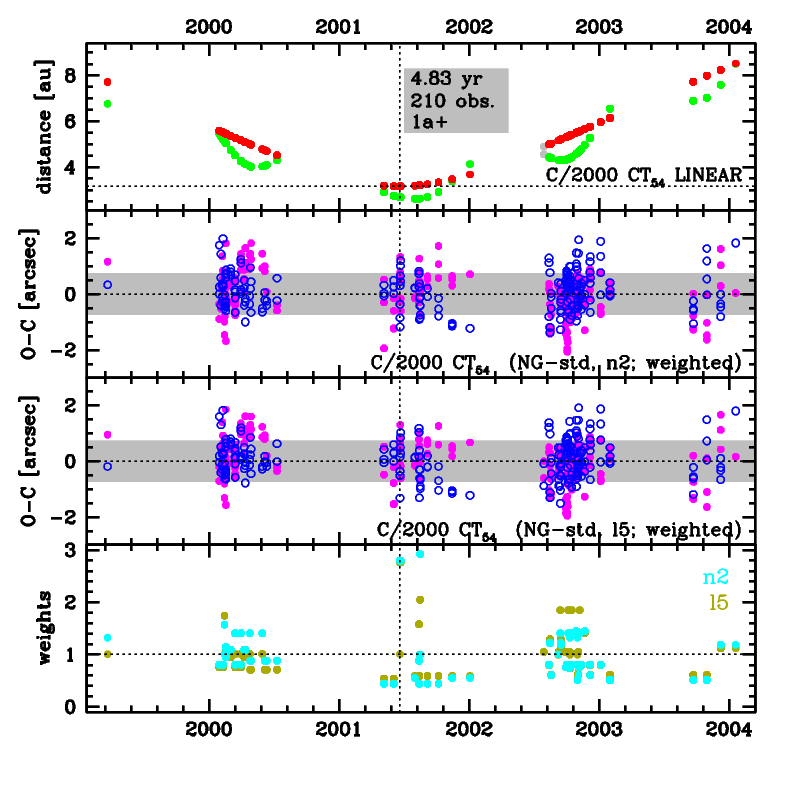
Upper panel: Time distribution of positional observations with corresponding heliocentric (red curve) and geocentric (green curve) distance at which they were taken. The horizontal dotted line shows the perihelion distance for a given comet whereas vertical dotted line — the moment of perihelion passage.
Middle panel(s): O-C diagram for a given solution (sometimes in comparison to another solution available in CODE), where residuals in right ascension are shown using magenta dots and in declination by blue open circles.
Lowest panel: Relative weights for a given data set(s).
Middle panel(s): O-C diagram for a given solution (sometimes in comparison to another solution available in CODE), where residuals in right ascension are shown using magenta dots and in declination by blue open circles.
Lowest panel: Relative weights for a given data set(s).
| next_g orbit statistics, here only the Galactic tide has been included | ||
|---|---|---|
| no. of returning VCs in the swarm | 5001 | * |
| no. of escaping VCs in the swarm | 0 | |
| no. of hyperbolas among escaping VCs in the swarm | 0 | |
| next reciprocal semi-major axis [10-6 au-1] | 582.18 – 585.31 – 588.55 | |
| next perihelion distance [au] | 3.1532 – 3.15321 – 3.15321 | |
| next aphelion distance [103 au] | 3.395 – 3.414 – 3.432 | |
| time interval to next perihelion [Myr] | 0.06968 – 0.07026 – 0.07086 | |
| percentage of VCs with qnext < 10 | 100 | |