C/2000 H1 LINEAR
more info
Comet C/2000 H1 was discovered three months after perihelion passage and next observed up to one year in a range of heliocentric distances from 3.72 au to 5.35 au. However, the observations are unevenly distributed in this period – there is a ten-month gap between 28 June 2000 and 24 April 2001.
Comet had its closest approach to the Earth on 19 May 2000 (3.385 au).
This Oort spike comet suffers moderate planetary perturbations during its passage through the planetary system that lead to a more tight future orbit (see future barycentric orbit).
See also Królikowska and Dybczyński 2017.
Comet had its closest approach to the Earth on 19 May 2000 (3.385 au).
This Oort spike comet suffers moderate planetary perturbations during its passage through the planetary system that lead to a more tight future orbit (see future barycentric orbit).
See also Królikowska and Dybczyński 2017.
| solution description | ||
|---|---|---|
| number of observations | 116 | |
| data interval | 2000 04 26 – 2001 04 25 | |
| data type | observed only after perihelion (POST) | |
| data arc selection | entire data set (STD) | |
| range of heliocentric distances | 3.72 au – 5.35au | |
| detectability of NG effects in the comet's motion | NG effects not determinable | |
| type of model of motion | GR - gravitational orbit | |
| data weighting | YES | |
| number of residuals | 228 | |
| RMS [arcseconds] | 0.60 | |
| orbit quality class | 2a | |
| orbital elements (barycentric ecliptic J2000) | ||
|---|---|---|
| Epoch | 2306 01 13 | |
| perihelion date | 2000 01 28.16800642 | ± 0.00635139 |
| perihelion distance [au] | 3.63890839 | ± 0.00004619 |
| eccentricity | 0.99901832 | ± 0.00014000 |
| argument of perihelion [°] | 78.800614 | ± 0.000827 |
| ascending node [°] | 356.501115 | ± 0.000262 |
| inclination [°] | 118.289374 | ± 0.000111 |
| reciprocal semi-major axis [10-6 au-1] | 269.77 | ± 38.48 |
| file containing 5001 VCs swarm |
|---|
| 2000h1a5.bpl |
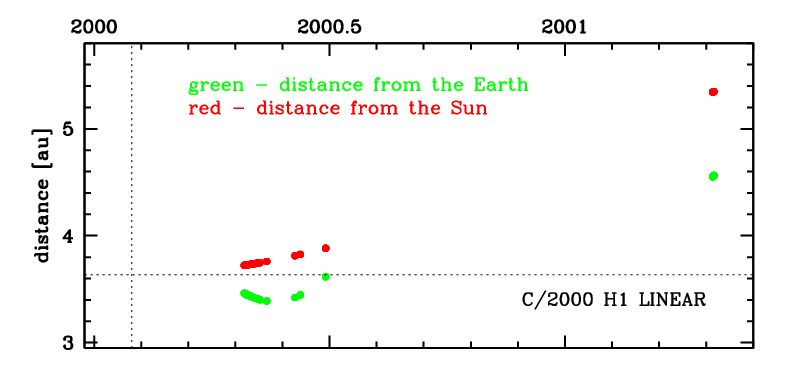
Time distribution of positional observations with corresponding heliocentric (red curve) and geocentric (green curve) distance at which they were taken. The horizontal dotted line shows the perihelion distance for a given comet whereas vertical dotted line — the moment of perihelion passage.
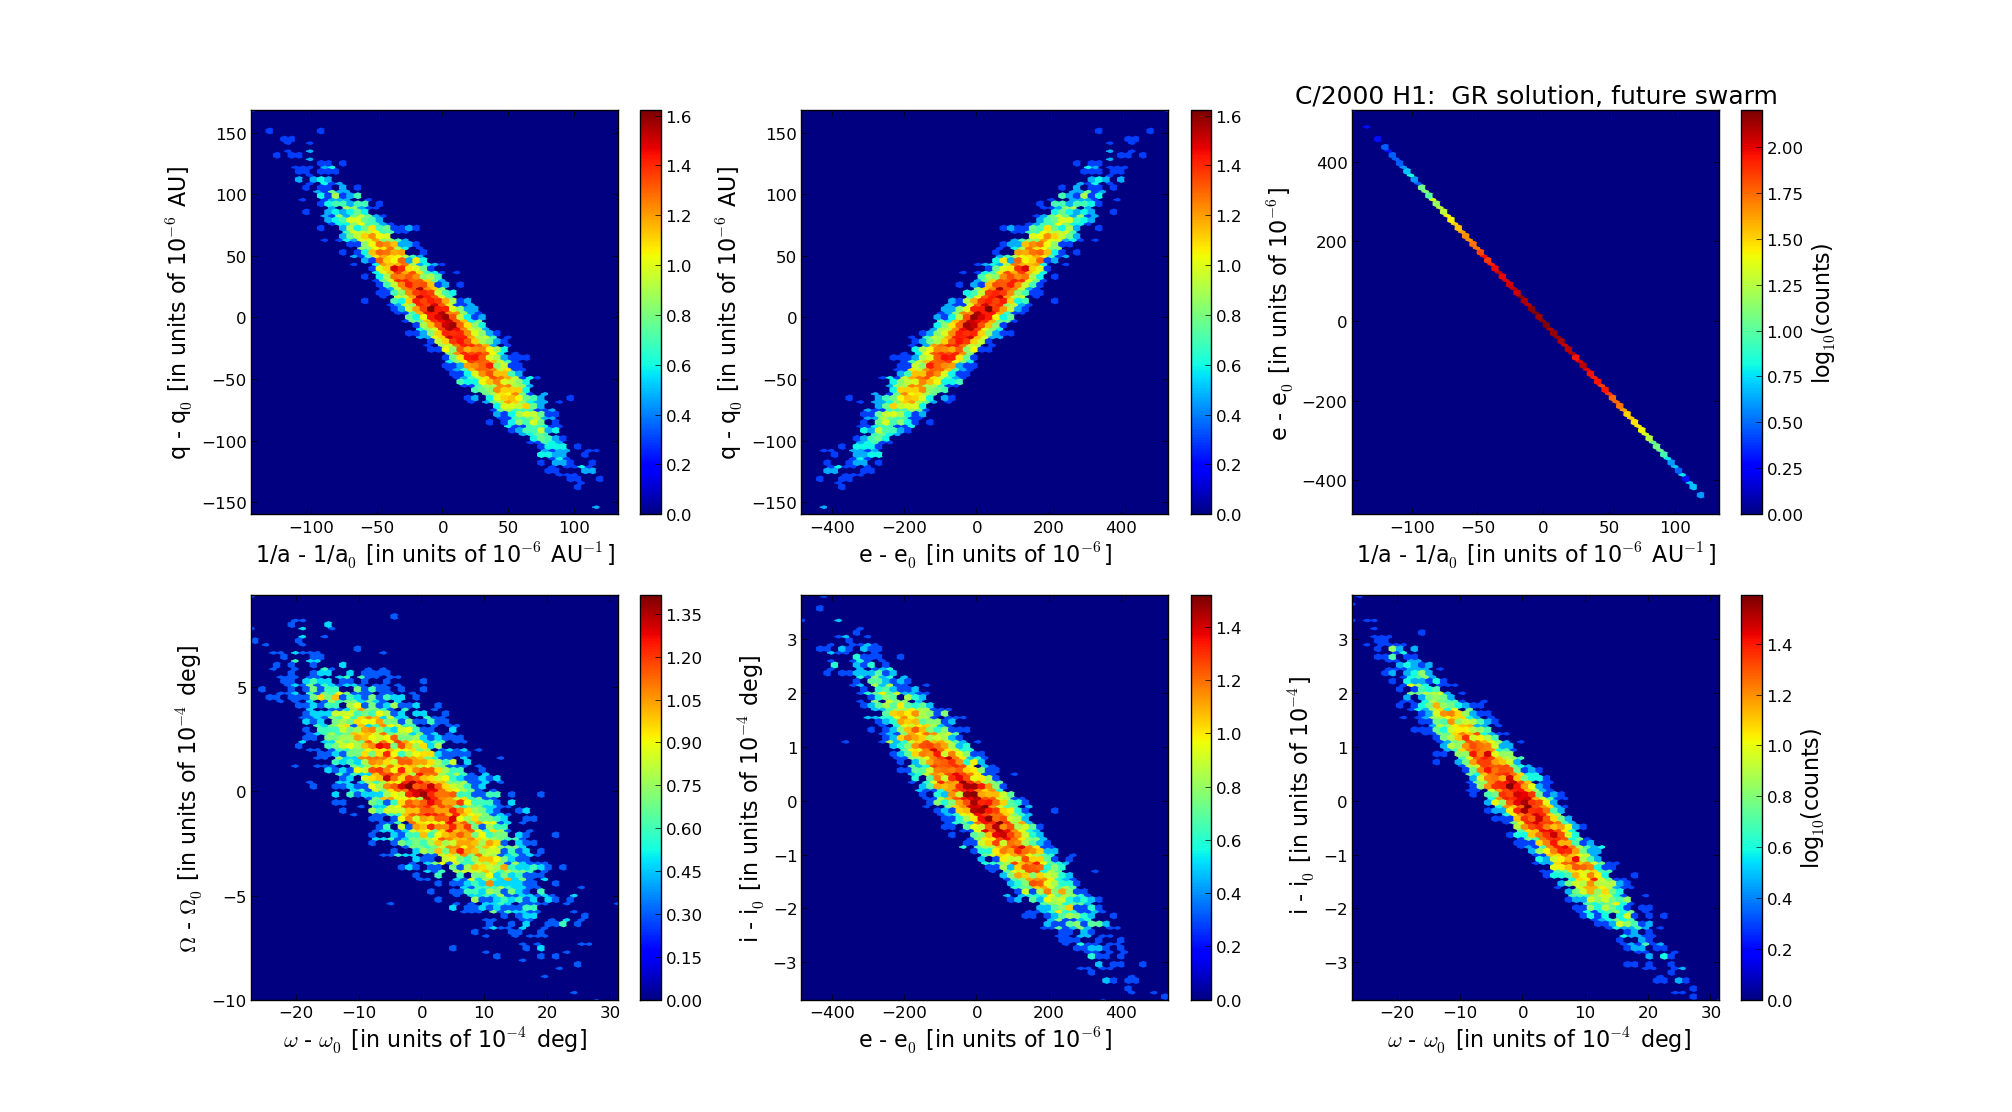
Six 2D-projections of the 6D space of future swarm including 5001 VCs. Each density map is given in logarithmic scale presented on the right in the individual panel.