C/2000 O1 Koehn
more info
C/2000 O1 was discovered on 26 May 2000 by B.W. Koehn in the course of the LONEOS as a cometary object [IAUC 7462, 2000 July 23]. Positional observations of this comet were next linked by Brian G. Marsden with pre-discovery measurements of two asteroidal objects observed by LINEAR (1998 XA70 = 1999 UJ10) going back to 14 December 1998 [MPEC 2000-O22].
This comet made its closest approach to the Earth on 9 November 1999 (5.050 au), 2.5 months before perihelion.
Solution given here is based on data spanning over 2.7 yr in a range of heliocentric distances: 6.58 au – 5.922 au (perihelion) – 7.15 au.
This Oort spike comet suffers small planetary perturbations during its passage through the planetary system that lead to a more tight future orbit (see future barycentric orbit).
See also Królikowska 2014 and Królikowska and Dybczyński 2017.
| solution description | ||
|---|---|---|
| number of observations | 65 | |
| data interval | 1998 12 14 – 2001 08 27 | |
| data type | perihelion within the observation arc (FULL) | |
| data arc selection | entire data set (STD) | |
| range of heliocentric distances | 6.58 au – 5.92 au (perihelion) – 7.15 au | |
| detectability of NG effects in the comet's motion | NG effects not determinable | |
| type of model of motion | GR - gravitational orbit | |
| data weighting | YES | |
| number of residuals | 128 | |
| RMS [arcseconds] | 0.81 | |
| orbit quality class | 1a | |
| previous orbit statistics, both Galactic and stellar perturbations were taken into account | ||
|---|---|---|
| no. of returning VCs in the swarm | 5001 | * |
| no. of escaping VCs in the swarm | 0 | |
| no. of hyperbolas among escaping VCs in the swarm | 0 | |
| previous reciprocal semi-major axis [10-6 au-1] | 47.49 – 55.12 – 59.53 | |
| previous perihelion distance [au] | 7.8 – 47 – 260 | |
| previous aphelion distance [103 au] | 33.6 – 36.3 – 41.9 | |
| time interval to previous perihelion [Myr] | 2.3 – 2.7 – 3.2 | |
| percentage of VCs with qprev < 10 | 35 | |
| percentage of VCs with 10 < qprev < 20 | 5 | |
| percentage of VCs with qprev > 20 | 60 | |
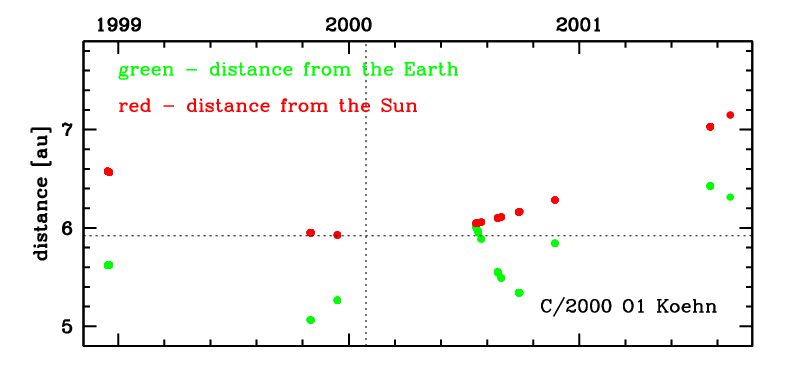
Time distribution of positional observations with corresponding heliocentric (red curve) and geocentric (green curve) distance at which they were taken. The horizontal dotted line shows the perihelion distance for a given comet whereas vertical dotted line — the moment of perihelion passage.
| previous_g orbit statistics, here only the Galactic tide has been included | ||
|---|---|---|
| no. of returning VCs in the swarm | 5001 | * |
| no. of escaping VCs in the swarm | 0 | |
| no. of hyperbolas among escaping VCs in the swarm | 0 | |
| previous reciprocal semi-major axis [10-6 au-1] | 45.92 – 51.92 – 58.06 | |
| previous perihelion distance [au] | 7.35 – 8.16 – 9.67 | |
| previous aphelion distance [103 au] | 34 – 39 – 44 | |
| time interval to previous perihelion [Myr] | 2.3 – 2.7 – 3.2 | |
| percentage of VCs with qprev < 10 | 93 | |
| percentage of VCs with 10 < qprev < 20 | 7 | |