C/2000 SV74 LINEAR
more info
Comet C/2000 SV74 was discovered on 24 September 2009 by LINEAR as an apparently asteroidal object; CCD images taken by Milos Tichy (Klet Observatory) on 19 October 2000 revealed a cometary appearance [[IAUC 7510, 2000 October 19]. Later, five images of this object were found on LINEAR exposures taken on 5 September 2000. Comet passed perihelion at the end of April 2002.
C/2000 SV74 was observed 4.7 yr in a range of heliocentric distances: 6.26 au – 3.542 au (perihelion) – 9.51 au.
Comet had its closest approach to Earth on 3 November 2001 (3.195 au, six months before perihelion).
Nongravitational solution bbased on entire data arc still reveals some trends in (O-C) where most evident are in the last opposition; NG orbits independently using pre-perihelion and post-perihelion data are also determinable.
Nakano non-gravitational solution [ Nakano Notes 1258] also shows trends in (O-C) in the last opposition. This solution, derived by T. Kobayashi, is based on 2116 observations (arc: 2000 September 5 to 2005 April 15; rms = 0.60 arcsec) and the NG-effects of sublimating CO-molecule (or N2) using Yabushita's theory (MNRAS 283, 347), and gives 1/aorigin = +0.000074, 1/afuture = -0.000073).
See also Królikowska and Dones 2023 and Królikowska and Dybczyński 2017.
| solution description | ||
|---|---|---|
| number of observations | 757 | |
| data interval | 2000 09 05 – 2002 04 05 | |
| data arc selection | data generally limited to pre-perihelion (PRE) | |
| range of heliocentric distances | 6.26 au – 3.55au | |
| type of model of motion | NC - non-gravitational orbits for symmetric CO-g(r)-like function | |
| data weighting | YES | |
| number of residuals | 1486 | |
| RMS [arcseconds] | 0.53 | |
| orbit quality class | 1b | |
| orbital elements (barycentric ecliptic J2000) | ||
|---|---|---|
| Epoch | 1699 03 15 | |
| perihelion date | 2002 04 30.04147356 | ± 0.00367718 |
| perihelion distance [au] | 3.52622249 | ± 0.00003213 |
| eccentricity | 0.99983968 | ± 0.00001541 |
| argument of perihelion [°] | 76.497572 | ± 0.000545 |
| ascending node [°] | 24.153224 | ± 0.000026 |
| inclination [°] | 75.359598 | ± 0.000142 |
| reciprocal semi-major axis [10-6 au-1] | 45.46 | ± 4.37 |
| file containing 5001 VCs swarm |
|---|
| 2000svqc.bmi |
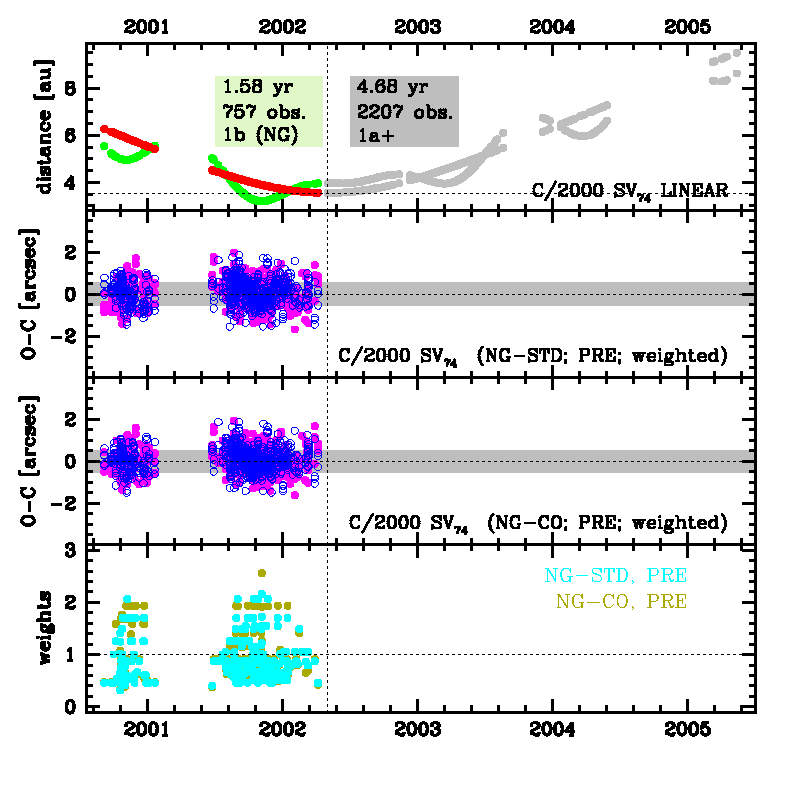
Upper panel: Time distribution of positional observations with corresponding heliocentric (red curve) and geocentric (green curve) distance at which they were taken. The horizontal dotted line shows the perihelion distance for a given comet whereas vertical dotted line — the moment of perihelion passage.
Middle panel(s): O-C diagram for a given solution (sometimes in comparison to another solution available in CODE), where residuals in right ascension are shown using magenta dots and in declination by blue open circles.
Lowest panel: Relative weights for a given data set(s).
Middle panel(s): O-C diagram for a given solution (sometimes in comparison to another solution available in CODE), where residuals in right ascension are shown using magenta dots and in declination by blue open circles.
Lowest panel: Relative weights for a given data set(s).
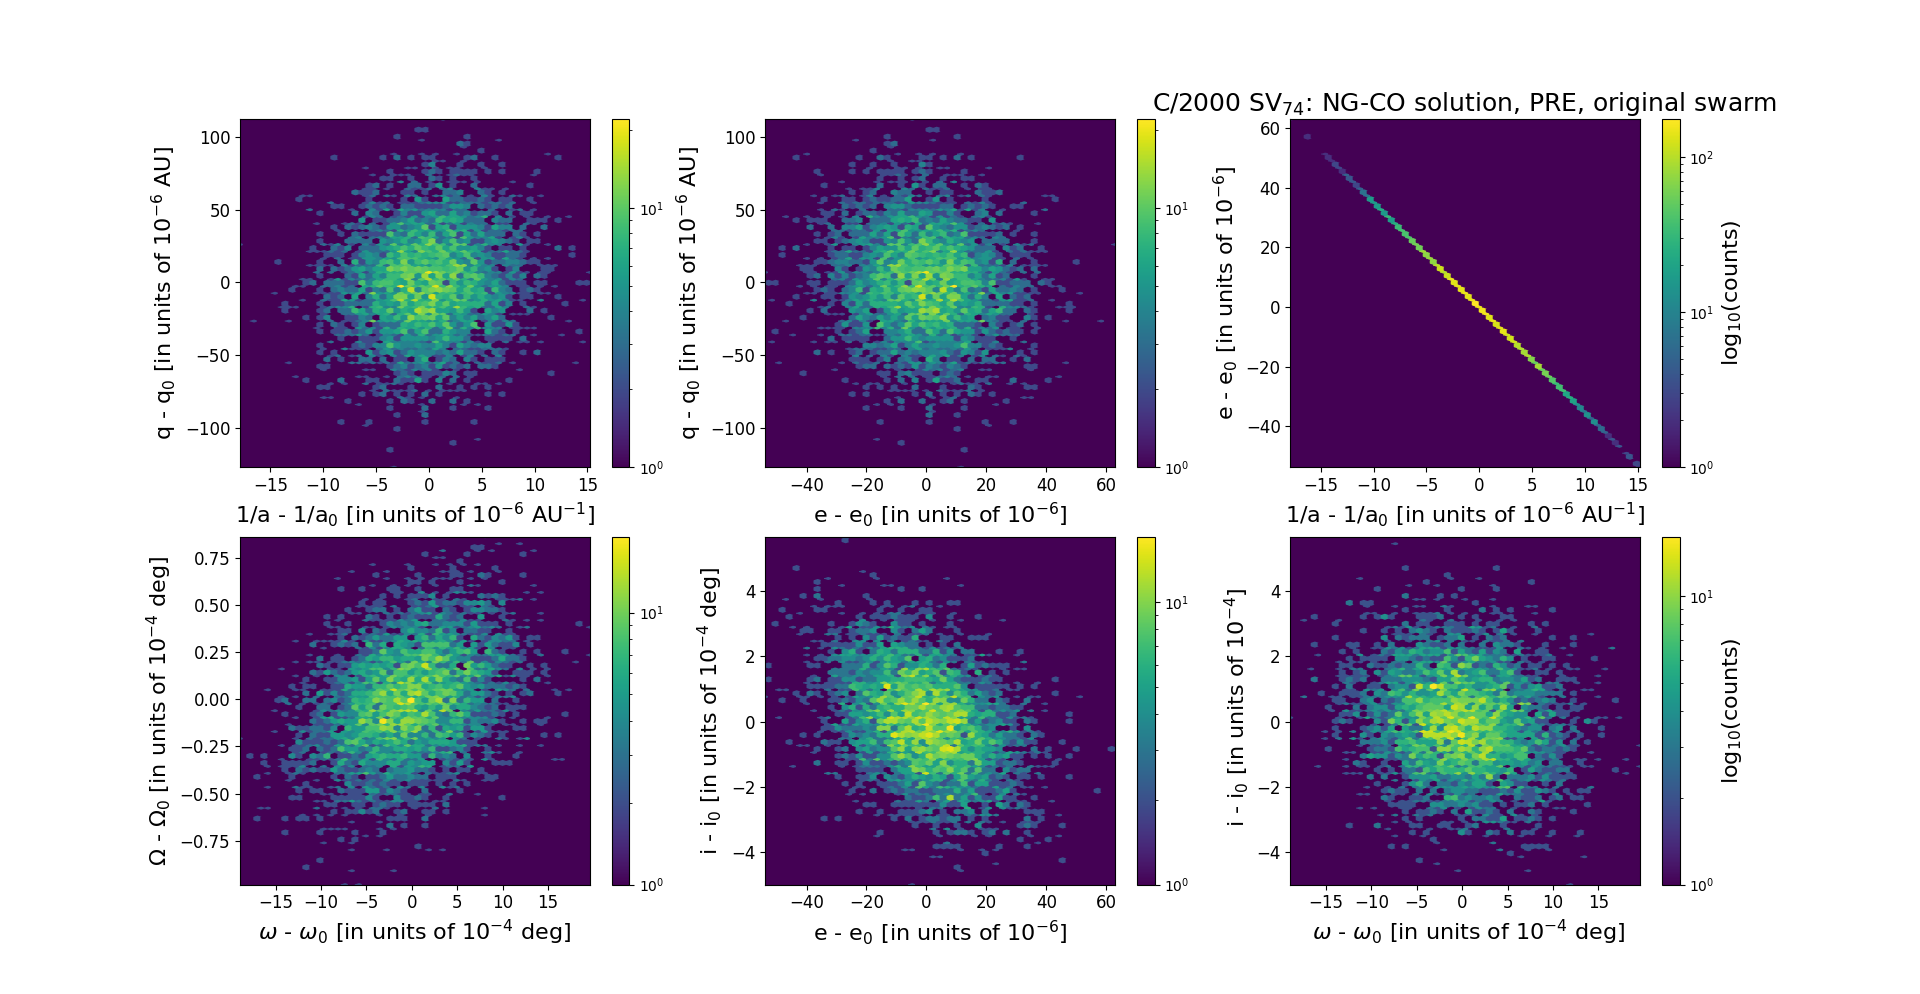
Six 2D-projections of the 6D space of original swarm including 5001 VCs. Each density map is given in logarithmic scale presented on the right in the individual panel.