C/2001 B1 LINEAR
more info
Comet C/2001 B1 was discovered on 22 January 2001 with Lincoln Laboratory Near-Earth Asteroid Research project, that is 4 months after its perihelion passage. It was observed until 8 January 2002.
Comet had its closest approach to the Earth on 5 December 2000 (2.544 au), 2.5 months after its perihelion passage and 1.5 month before discovery.
Solution given here is based on data spanning over 0.961 yr in a range of heliocentric distances from 3.18 au to 5.34 au.
This Oort spike comet suffers small planetary perturbations during its passage through the planetary system; however, these perturbations lead to escape the comet from the planetary zone on a hyperbolic orbit (see future barycentric orbits).
See also Królikowska 2020.
| solution description | ||
|---|---|---|
| number of observations | 169 | |
| data interval | 2001 01 22 – 2002 01 08 | |
| data type | observed only after perihelion (POST) | |
| data arc selection | entire data set (STD) | |
| range of heliocentric distances | 3.18 au – 5.34au | |
| detectability of NG effects in the comet's motion | NG effects not determinable | |
| type of model of motion | GR - gravitational orbit | |
| data weighting | YES | |
| number of residuals | 332 | |
| RMS [arcseconds] | 0.57 | |
| orbit quality class | 1b | |
| previous orbit statistics, both Galactic and stellar perturbations were taken into account | ||
|---|---|---|
| no. of returning VCs in the swarm | 5001 | * |
| no. of escaping VCs in the swarm | 0 | |
| no. of hyperbolas among escaping VCs in the swarm | 0 | |
| previous reciprocal semi-major axis [10-6 au-1] | 76.50 – 78.94 – 81.41 | |
| previous perihelion distance [au] | 3.09 – 3.112 – 3.139 | |
| previous aphelion distance [103 au] | 24.6 – 25.3 – 26.1 | |
| time interval to previous perihelion [Myr] | 1.36 – 1.42 – 1.49 | |
| percentage of VCs with qprev < 10 | 100 | |
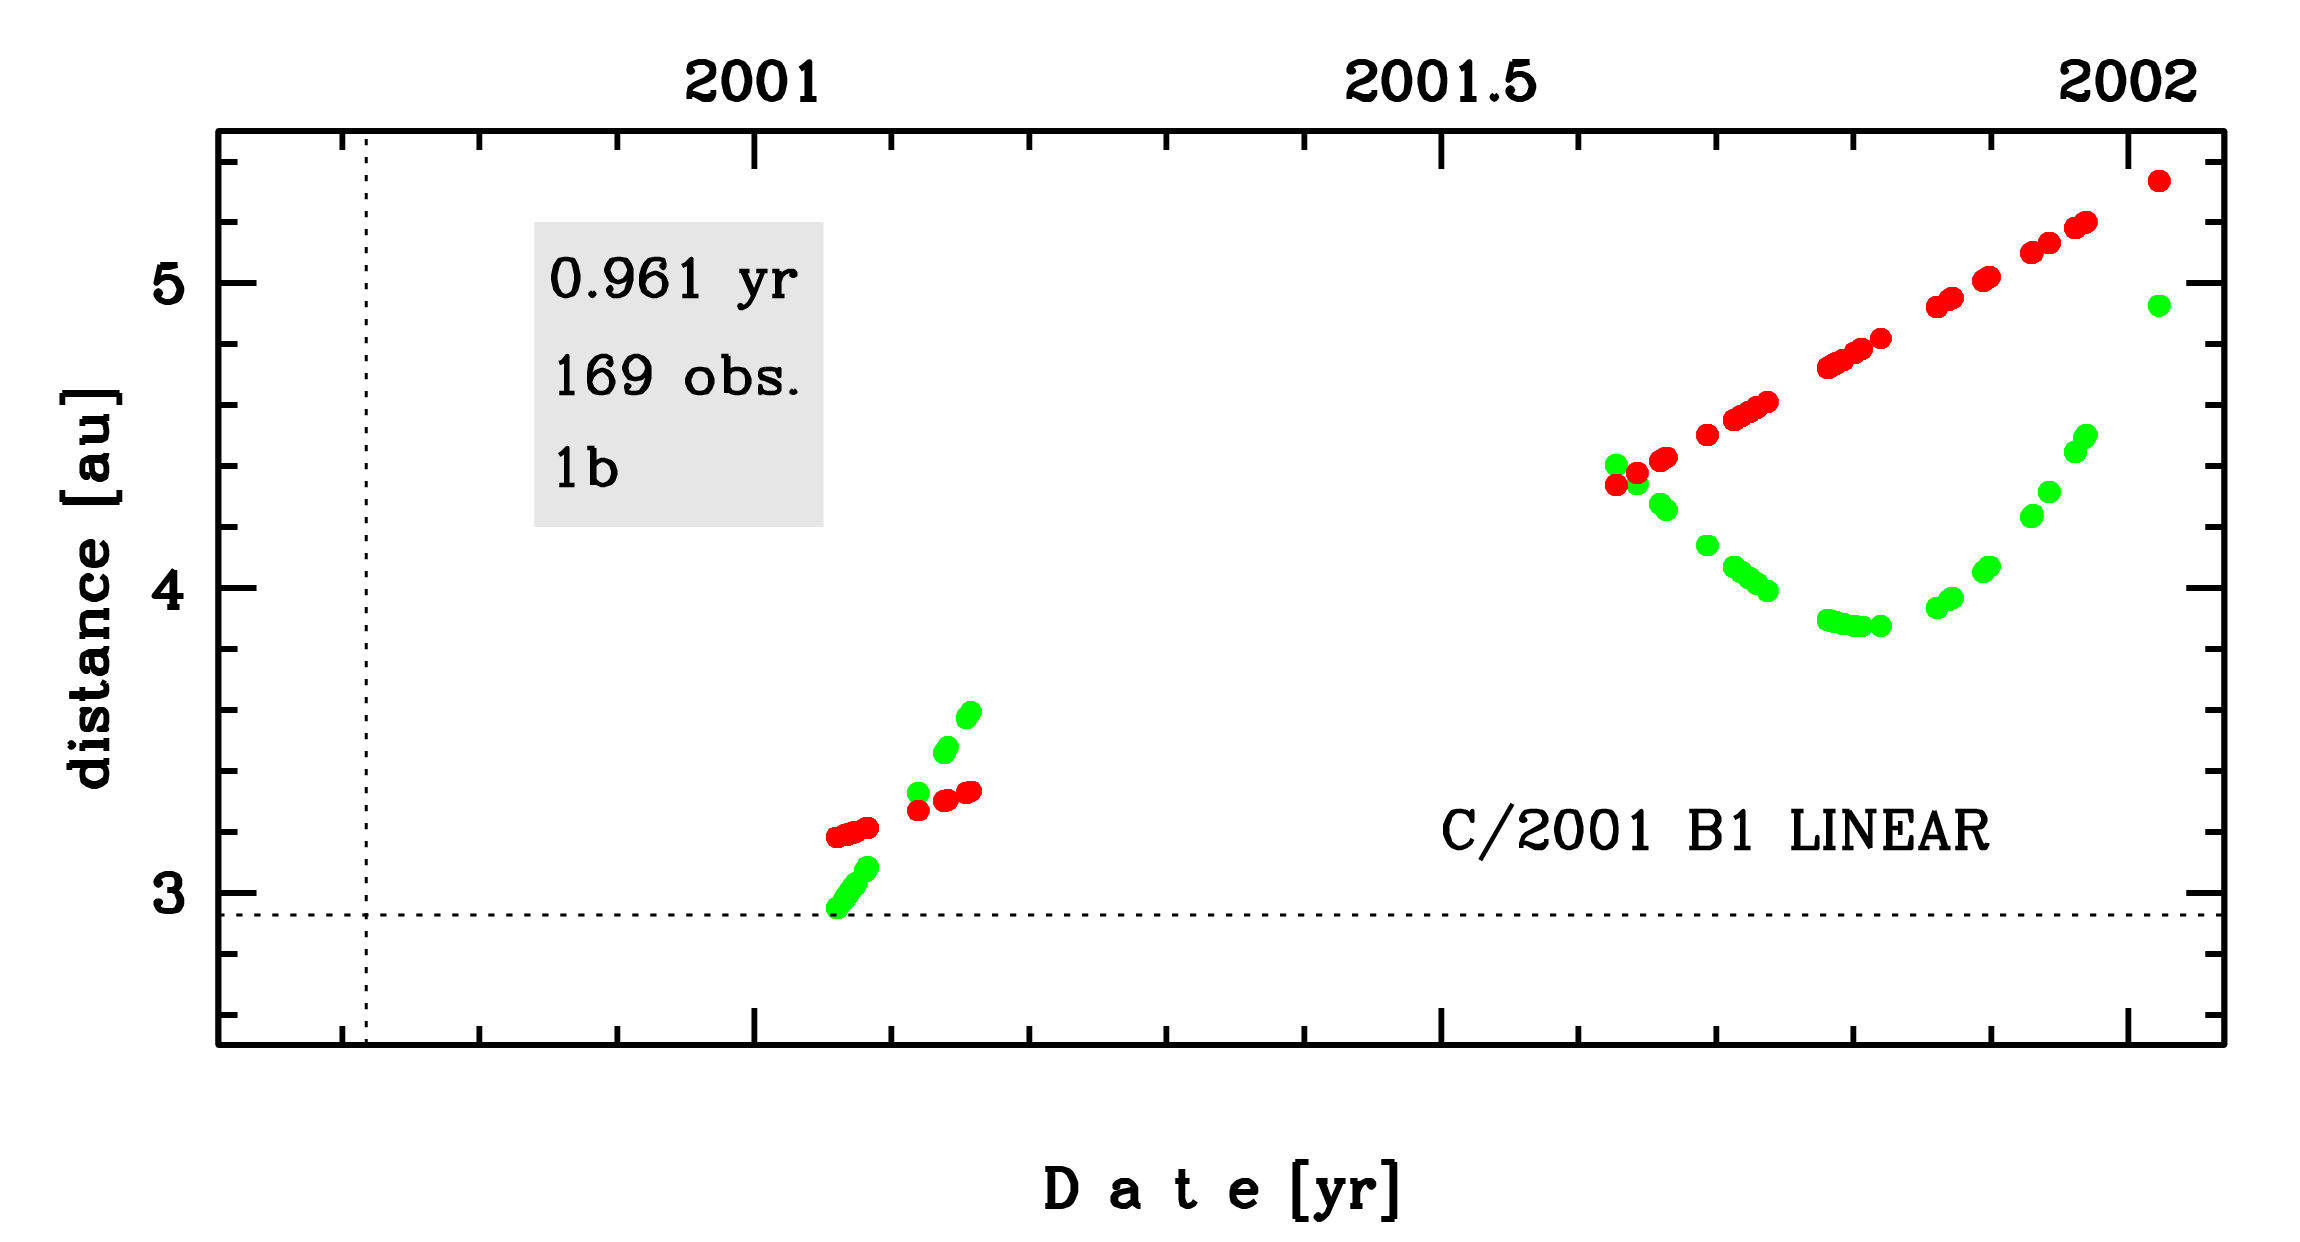
Time distribution of positional observations with corresponding heliocentric (red curve) and geocentric (green curve) distance at which they were taken. The horizontal dotted line shows the perihelion distance for a given comet whereas vertical dotted line — the moment of perihelion passage.
| previous_g orbit statistics, here only the Galactic tide has been included | ||
|---|---|---|
| no. of returning VCs in the swarm | 5001 | * |
| no. of escaping VCs in the swarm | 0 | |
| no. of hyperbolas among escaping VCs in the swarm | 0 | |
| previous reciprocal semi-major axis [10-6 au-1] | 76.50 – 78.94 – 81.41 | |
| previous perihelion distance [au] | 3.075 – 3.094 – 3.115 | |
| previous aphelion distance [103 au] | 24.6 – 25.3 – 26.1 | |
| time interval to previous perihelion [Myr] | 1.36 – 1.42 – 1.49 | |
| percentage of VCs with qprev < 10 | 100 | |