C/2001 Q4 NEAT
more info
Comet C/2001 Q4 was discovered on 24 August 2001 by Near-Earth-Asteroid Tracking Team (Jet Propulsion Laboratory), that is about 2.8 yr before its perihelion passage. It was observed until 18 August 2004.
Comet had its closest approach to the Earth on 6 May 2004 (0.321 au), ten days before its perihelion passage.
C/2001 Q4 is a comet with non-gravitational effects strongly manifested in positional data fitting. Preferred orbital solution given here is based on data spanning over 4.98 yr in a range of heliocentric distances from 10.11 au to 8.82 au; however data taken around perihelion passage are excluded (see figure).
This Oort spike comet suffers rather large planetary perturbations during its passage through the planetary system; these perturbations lead to escape the comet from the planetary zone on a hyperbolic orbit (see future barycentric orbits).
More details in Królikowska, Dybczyński and Sitarski and Królikowska 2020.
| solution description | ||
|---|---|---|
| number of observations | 524 | |
| data interval | 2001 08 24 – 2004 04 15 | |
| data arc selection | data generally limited to pre-perihelion (PRE) | |
| range of heliocentric distances | 10.11 au – 1.09au | |
| detectability of NG effects in the comet's motion | comet with NG effects strongly manifested in positional data fitting | |
| type of model of motion | GR - gravitational orbit | |
| data weighting | YES | |
| number of residuals | 1030 | |
| RMS [arcseconds] | 0.52 | |
| orbit quality class | 1a | |
| orbital elements (barycentric ecliptic J2000) | ||
|---|---|---|
| Epoch | 1705 10 10 | |
| perihelion date | 2004 05 16.03659773 | ± 0.00010509 |
| perihelion distance [au] | 0.96048269 | ± 0.00000028 |
| eccentricity | 0.99995940 | ± 0.00000066 |
| argument of perihelion [°] | 1.321525 | ± 0.000036 |
| ascending node [°] | 210.315212 | ± 0.000015 |
| inclination [°] | 99.748733 | ± 0.000012 |
| reciprocal semi-major axis [10-6 au-1] | 42.27 | ± 0.69 |
| file containing 5001 VCs swarm |
|---|
| 2001q4pa.bmi |
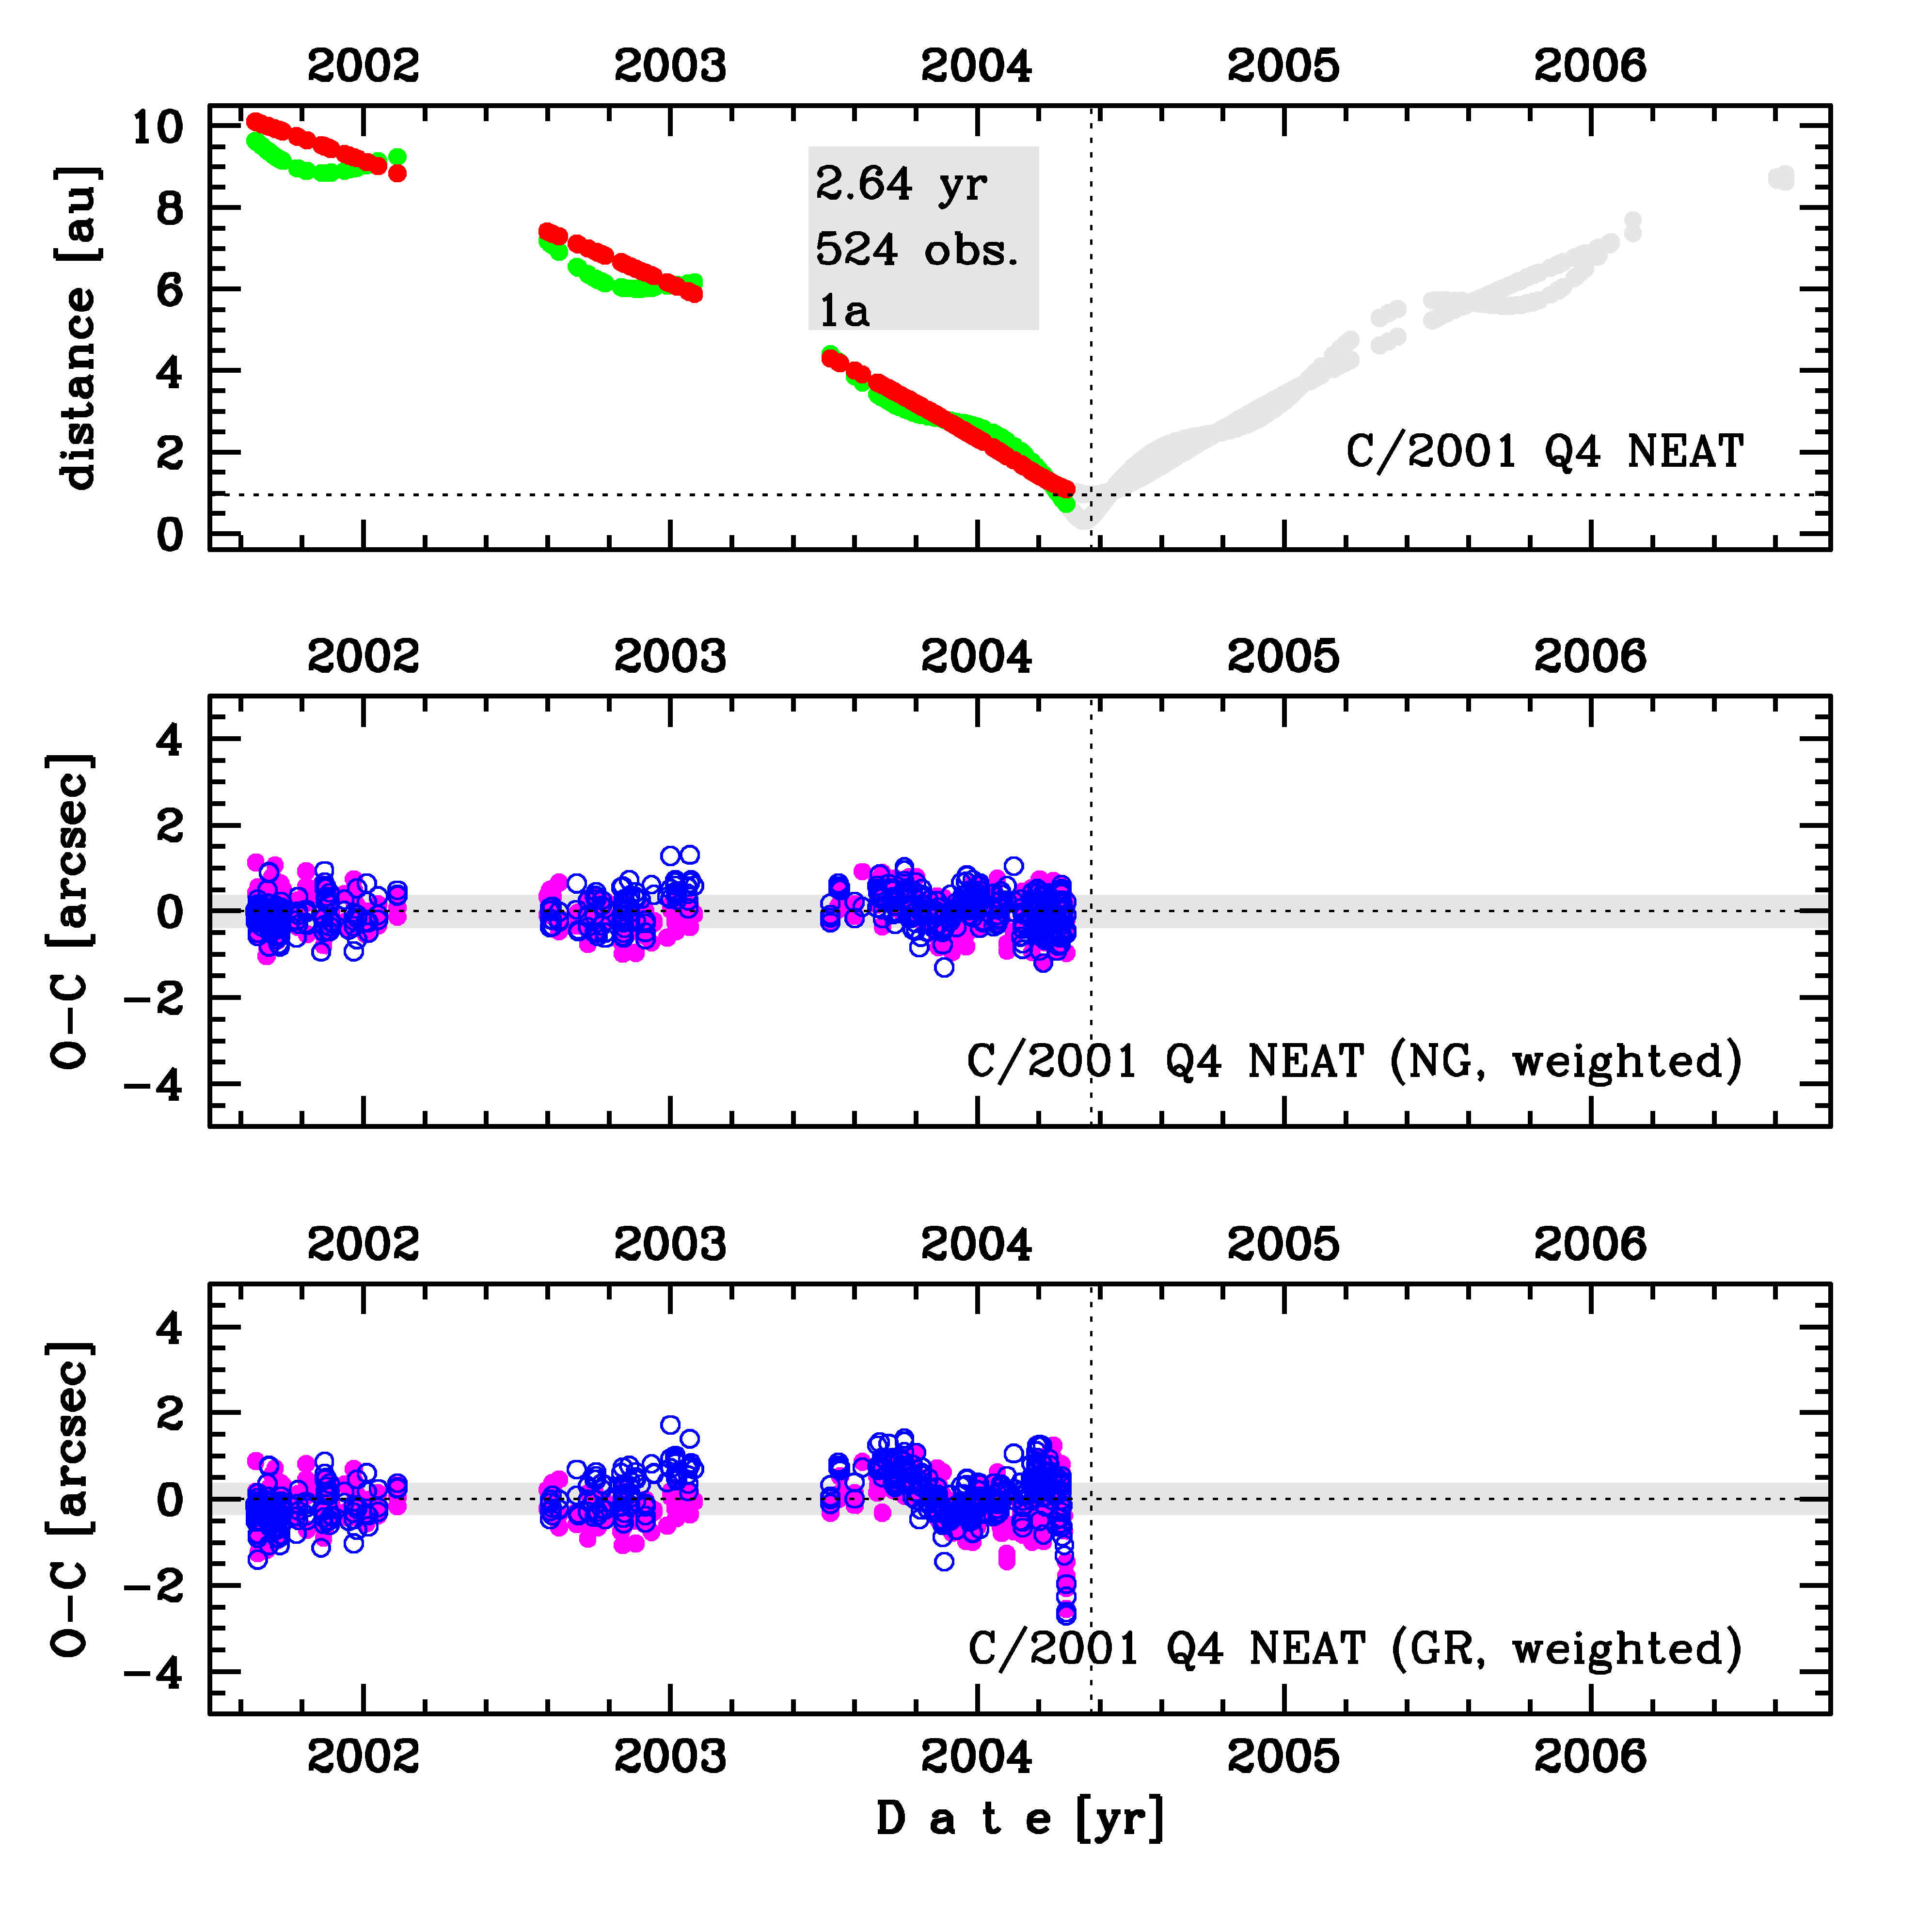
Upper panel: Time distribution of positional observations with corresponding heliocentric (red curve) and geocentric (green curve) distance at which they were taken. The horizontal dotted line shows the perihelion distance for a given comet whereas vertical dotted line — the moment of perihelion passage.
Lower panel (panels): O-C diagram for this(two) solution (solutions) given in this database, where residuals in right ascension are shown using magenta dots and in declination by blue open circles.
Lower panel (panels): O-C diagram for this(two) solution (solutions) given in this database, where residuals in right ascension are shown using magenta dots and in declination by blue open circles.
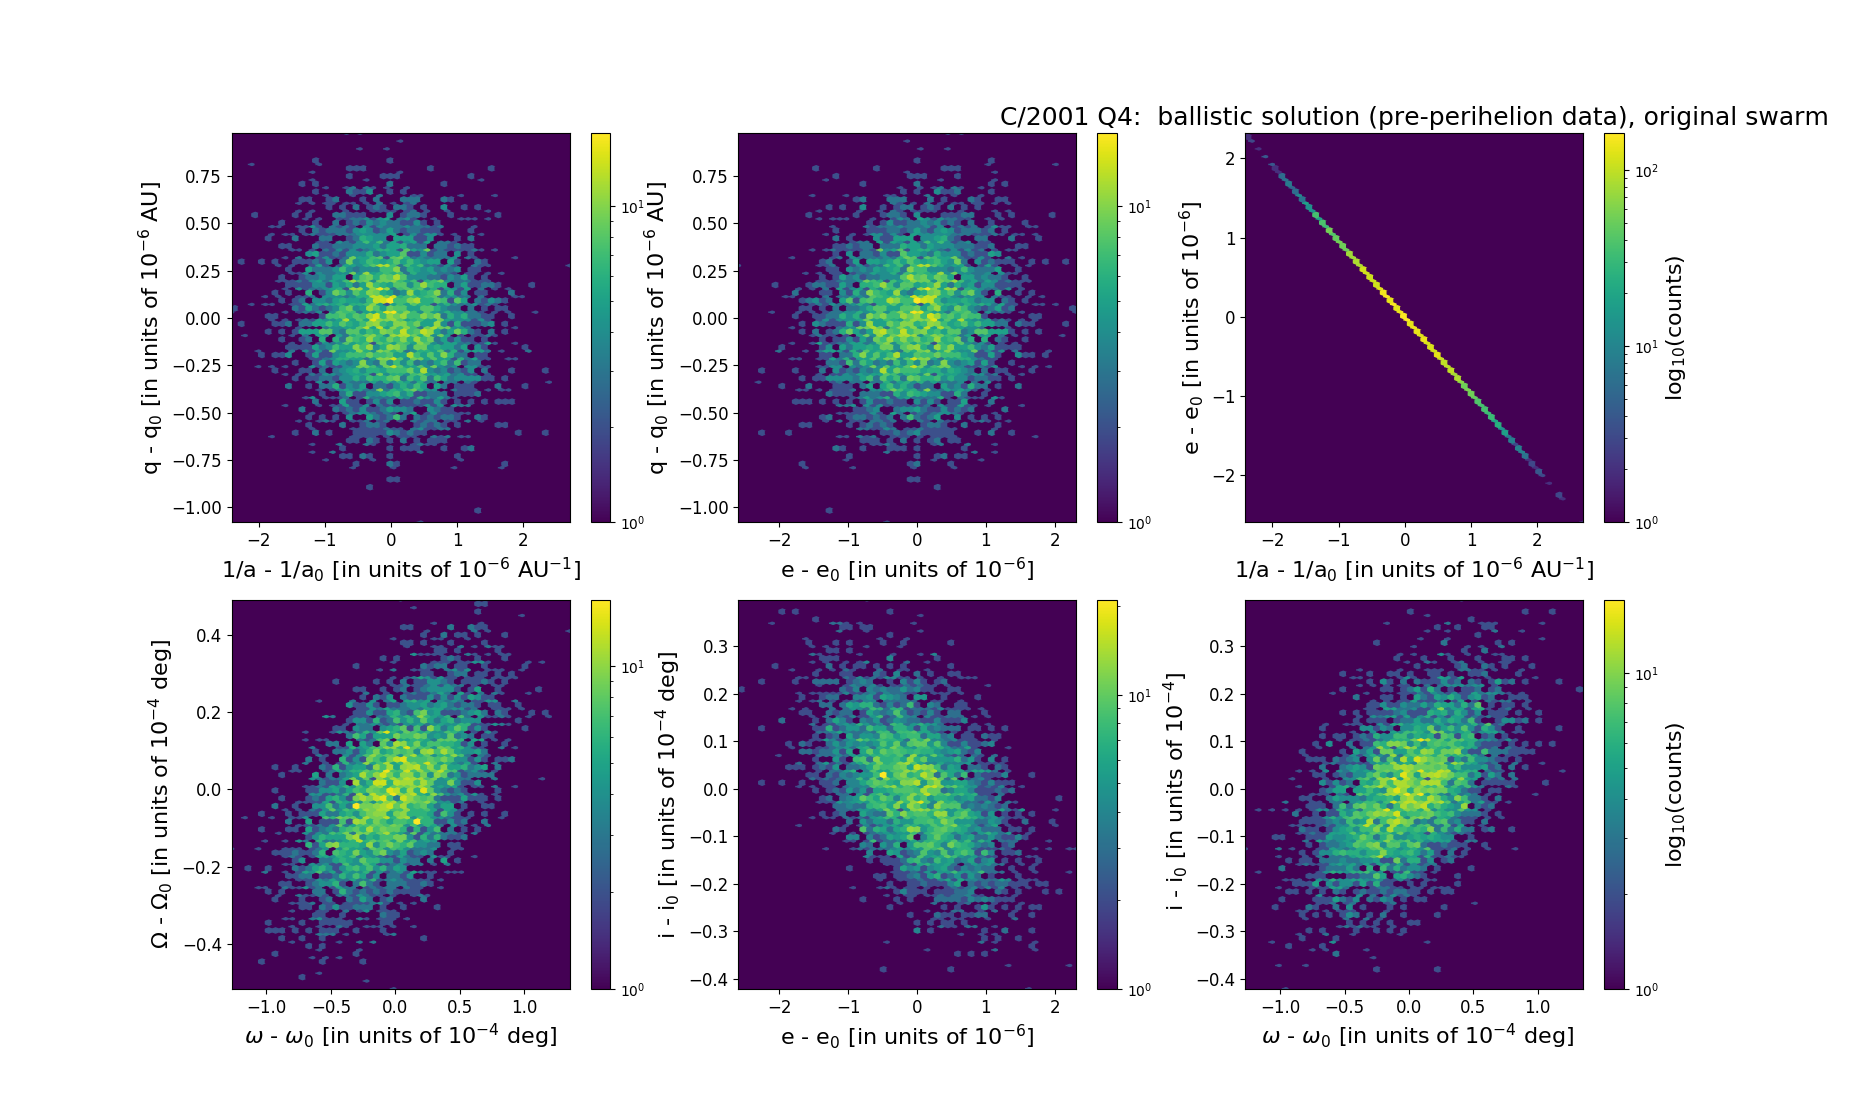
Six 2D-projections of the 6D space of original swarm including 5001 VCs. Each density map is given in logarithmic scale presented on the right in the individual panel.