C/2002 J5 LINEAR
more info
C/2002 J5 was discovered on 15 May 2002 by the LINEAR as an apparently asteroidal object. Next day, its cometary apperance was reported by M. Tichy and M. Kocer from Klet [IAUC 7904, 2002 May 18]. Later, pre-discovery detections (from August 2001) by LINEAR and AMOS were found.
This comet made its closest approach to the Earth on 19 June 2003 (5.233 au), three months before perihelion.
Solutions given here are based on data spanning over 4.6 yr in a range of heliocentric distances: 7.87 au – 5.727 au (perihelion) – 8.44 au.
This Oort spike comet suffers slight planetary perturbations during its passage through the planetary system.
See also Królikowska and Dones 2023, Królikowska and Dybczyński 2017,and Królikowska 2014.
| solution description | ||
|---|---|---|
| number of observations | 618 | |
| data interval | 2001 08 06 – 2006 03 05 | |
| data type | perihelion within the observation arc (FULL) | |
| data arc selection | entire data set (STD) | |
| range of heliocentric distances | 7.87 au – 5.73 au (perihelion) – 8.44 au | |
| detectability of NG effects in the comet's motion | NG effects not determinable | |
| type of model of motion | GR - gravitational orbit | |
| data weighting | YES | |
| number of residuals | 1227 | |
| RMS [arcseconds] | 0.53 | |
| orbit quality class | 1a+ | |
| next orbit statistics, both Galactic and stellar perturbations were taken into account | ||
|---|---|---|
| no. of returning VCs in the swarm | 8 | |
| no. of escaping VCs in the swarm | 4993 | * |
| no. of hyperbolas among escaping VCs in the swarm | 0 | |
| next reciprocal semi-major axis [10-6 au-1] | 13.79 – 14.60 – 15.43 | |
| next perihelion distance [au] | 93.9 – 96.4 – 99 | |
| next aphelion distance [103 au] | 130 – 137 – 145 | |
| synchronous stop epoch [Myr] | 4.32 | S |
| percentage of VCs with qnext > 20 | 100 | |
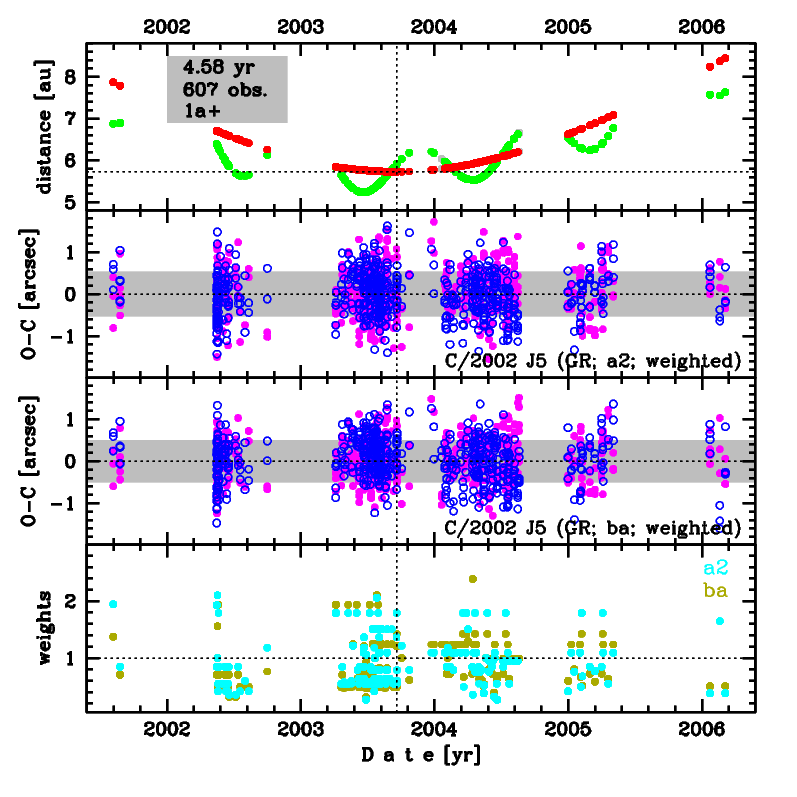
Upper panel: Time distribution of positional observations with corresponding heliocentric (red curve) and geocentric (green curve) distance at which they were taken. The horizontal dotted line shows the perihelion distance for a given comet whereas vertical dotted line — the moment of perihelion passage.
Middle panel(s): O-C diagram for a given solution (sometimes in comparison to another solution available in CODE), where residuals in right ascension are shown using magenta dots and in declination by blue open circles.
Lowest panel: Relative weights for a given data set(s).
Middle panel(s): O-C diagram for a given solution (sometimes in comparison to another solution available in CODE), where residuals in right ascension are shown using magenta dots and in declination by blue open circles.
Lowest panel: Relative weights for a given data set(s).
| next_g orbit statistics, here only the Galactic tide has been included | ||
|---|---|---|
| no. of returning VCs in the swarm | 0 | |
| no. of escaping VCs in the swarm | 5001 | * |
| no. of hyperbolas among escaping VCs in the swarm | 0 | |
| next reciprocal semi-major axis [10-6 au-1] | 13.17 – 13.99 – 14.83 | |
| next perihelion distance [au] | 30.7 – 33.3 – 36 | |
| next aphelion distance [103 au] | 135 – 143 – 152 | |
| synchronous stop epoch [Myr] | 4.43 | S |
| percentage of VCs with qnext > 20 | 100 | |