C/2002 L9 NEAT
more info
C/2002 L9 was discovered on 13 June 2002 by the NEAT as an apparently asteroidal object. Later, its cometary apperance was reported [IAUC 7931, 2002 July 2]. Later, a few pre-discovery detections by LINEAR were found.
This comet made its closest approach to the Earth on 30 July 2003 (6.365 au), eight months before perihelion.
Solution given here is based on data spanning over 4.6 yr in a range of heliocentric distances: 8.23 au – 7.033 au (perihelion) – 9.48 au.
This Oort spike comet suffers slight planetary perturbations during its passage through the planetary system.
See also Królikowska 2014 and Królikowska and Dybczyński 2017.
| solution description | ||
|---|---|---|
| number of observations | 323 | |
| data interval | 2002 06 06 – 2007 01 11 | |
| data type | perihelion within the observation arc (FULL) | |
| data arc selection | entire data set (STD) | |
| range of heliocentric distances | 8.23 au – 7.03 au (perihelion) – 9.48 au | |
| detectability of NG effects in the comet's motion | NG effects not determinable | |
| type of model of motion | GR - gravitational orbit | |
| data weighting | YES | |
| number of residuals | 634 | |
| RMS [arcseconds] | 0.49 | |
| orbit quality class | 1a+ | |
| next orbit statistics, both Galactic and stellar perturbations were taken into account | ||
|---|---|---|
| no. of returning VCs in the swarm | 5001 | * |
| no. of escaping VCs in the swarm | 0 | |
| no. of hyperbolas among escaping VCs in the swarm | 0 | |
| next reciprocal semi-major axis [10-6 au-1] | 74.84 – 75.76 – 76.58 | |
| next perihelion distance [au] | 7.9 – 9 – 10 | |
| next aphelion distance [103 au] | 26.1 – 26.4 – 26.7 | |
| time interval to next perihelion [Myr] | 1.42 – 1.45 – 1.49 | |
| percentage of VCs with qnext < 10 | 85 | |
| percentage of VCs with 10 < qnext < 20 | 15 | |
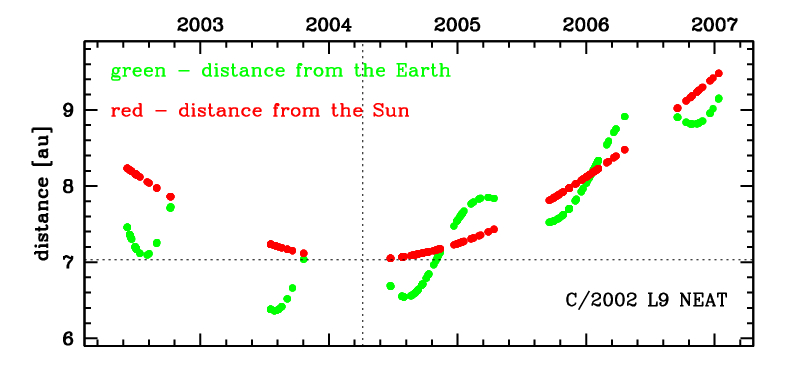
Time distribution of positional observations with corresponding heliocentric (red curve) and geocentric (green curve) distance at which they were taken. The horizontal dotted line shows the perihelion distance for a given comet whereas vertical dotted line — the moment of perihelion passage.
| next_g orbit statistics, here only the Galactic tide has been included | ||
|---|---|---|
| no. of returning VCs in the swarm | 5001 | * |
| no. of escaping VCs in the swarm | 0 | |
| no. of hyperbolas among escaping VCs in the swarm | 0 | |
| next reciprocal semi-major axis [10-6 au-1] | 76.60 – 77.78 – 78.90 | |
| next perihelion distance [au] | 6.463 – 6.491 – 6.515 | |
| next aphelion distance [103 au] | 25.3 – 25.7 – 26.1 | |
| time interval to next perihelion [Myr] | 1.42 – 1.45 – 1.49 | |
| percentage of VCs with qnext < 10 | 100 | |