C/2002 Q5 LINEAR
more info
Comet C/2002 Q5 was discovered on 28 August 2002 with Lincoln Laboratory Near-Earth Asteroid Research project, that is almost 3 months before its perihelion passage. It was observed until 30 May 2003.
Comet had its closest approach to the Earth on 30 August 2002 (0.994 au), two days after its discovery.
Solutions given here are based on data spanning over 0.753 yr in a range of heliocentric distances: 1.75 au – 1.24 au (perihelion) – 2.92 au.
This Oort spike comet suffers large planetary perturbations during its passage through the planetary system; these perturbations lead to escape the comet from the planetary zone on a hyperbolic orbit (see future barycentric orbits).
See also Królikowska 2014.
| solution description | ||
|---|---|---|
| number of observations | 605 | |
| data interval | 2002 08 28 – 2003 05 30 | |
| data type | perihelion within the observation arc (FULL) | |
| data arc selection | entire data set (STD) | |
| range of heliocentric distances | 1.75 au – 1.24 au (perihelion) – 2.92 au | |
| type of model of motion | NS - non-gravitational orbits for standard g(r) | |
| data weighting | YES | |
| number of residuals | 1195 | |
| RMS [arcseconds] | 0.57 | |
| orbit quality class | 1b | |
| previous orbit statistics, both Galactic and stellar perturbations were taken into account | ||
|---|---|---|
| no. of returning VCs in the swarm | 5001 | * |
| no. of escaping VCs in the swarm | 0 | |
| no. of hyperbolas among escaping VCs in the swarm | 0 | |
| previous reciprocal semi-major axis [10-6 au-1] | 36.30 – 41.18 – 54.88 | |
| previous perihelion distance [au] | 2.2 – 290 – 710 | |
| previous aphelion distance [103 au] | 36 – 48 – 54 | |
| time interval to previous perihelion [Myr] | 2.5 – 3 – 3.9 | |
| percentage of VCs with qprev < 10 | 12 | |
| percentage of VCs with 10 < qprev < 20 | 1 | |
| percentage of VCs with qprev > 20 | 87 | |
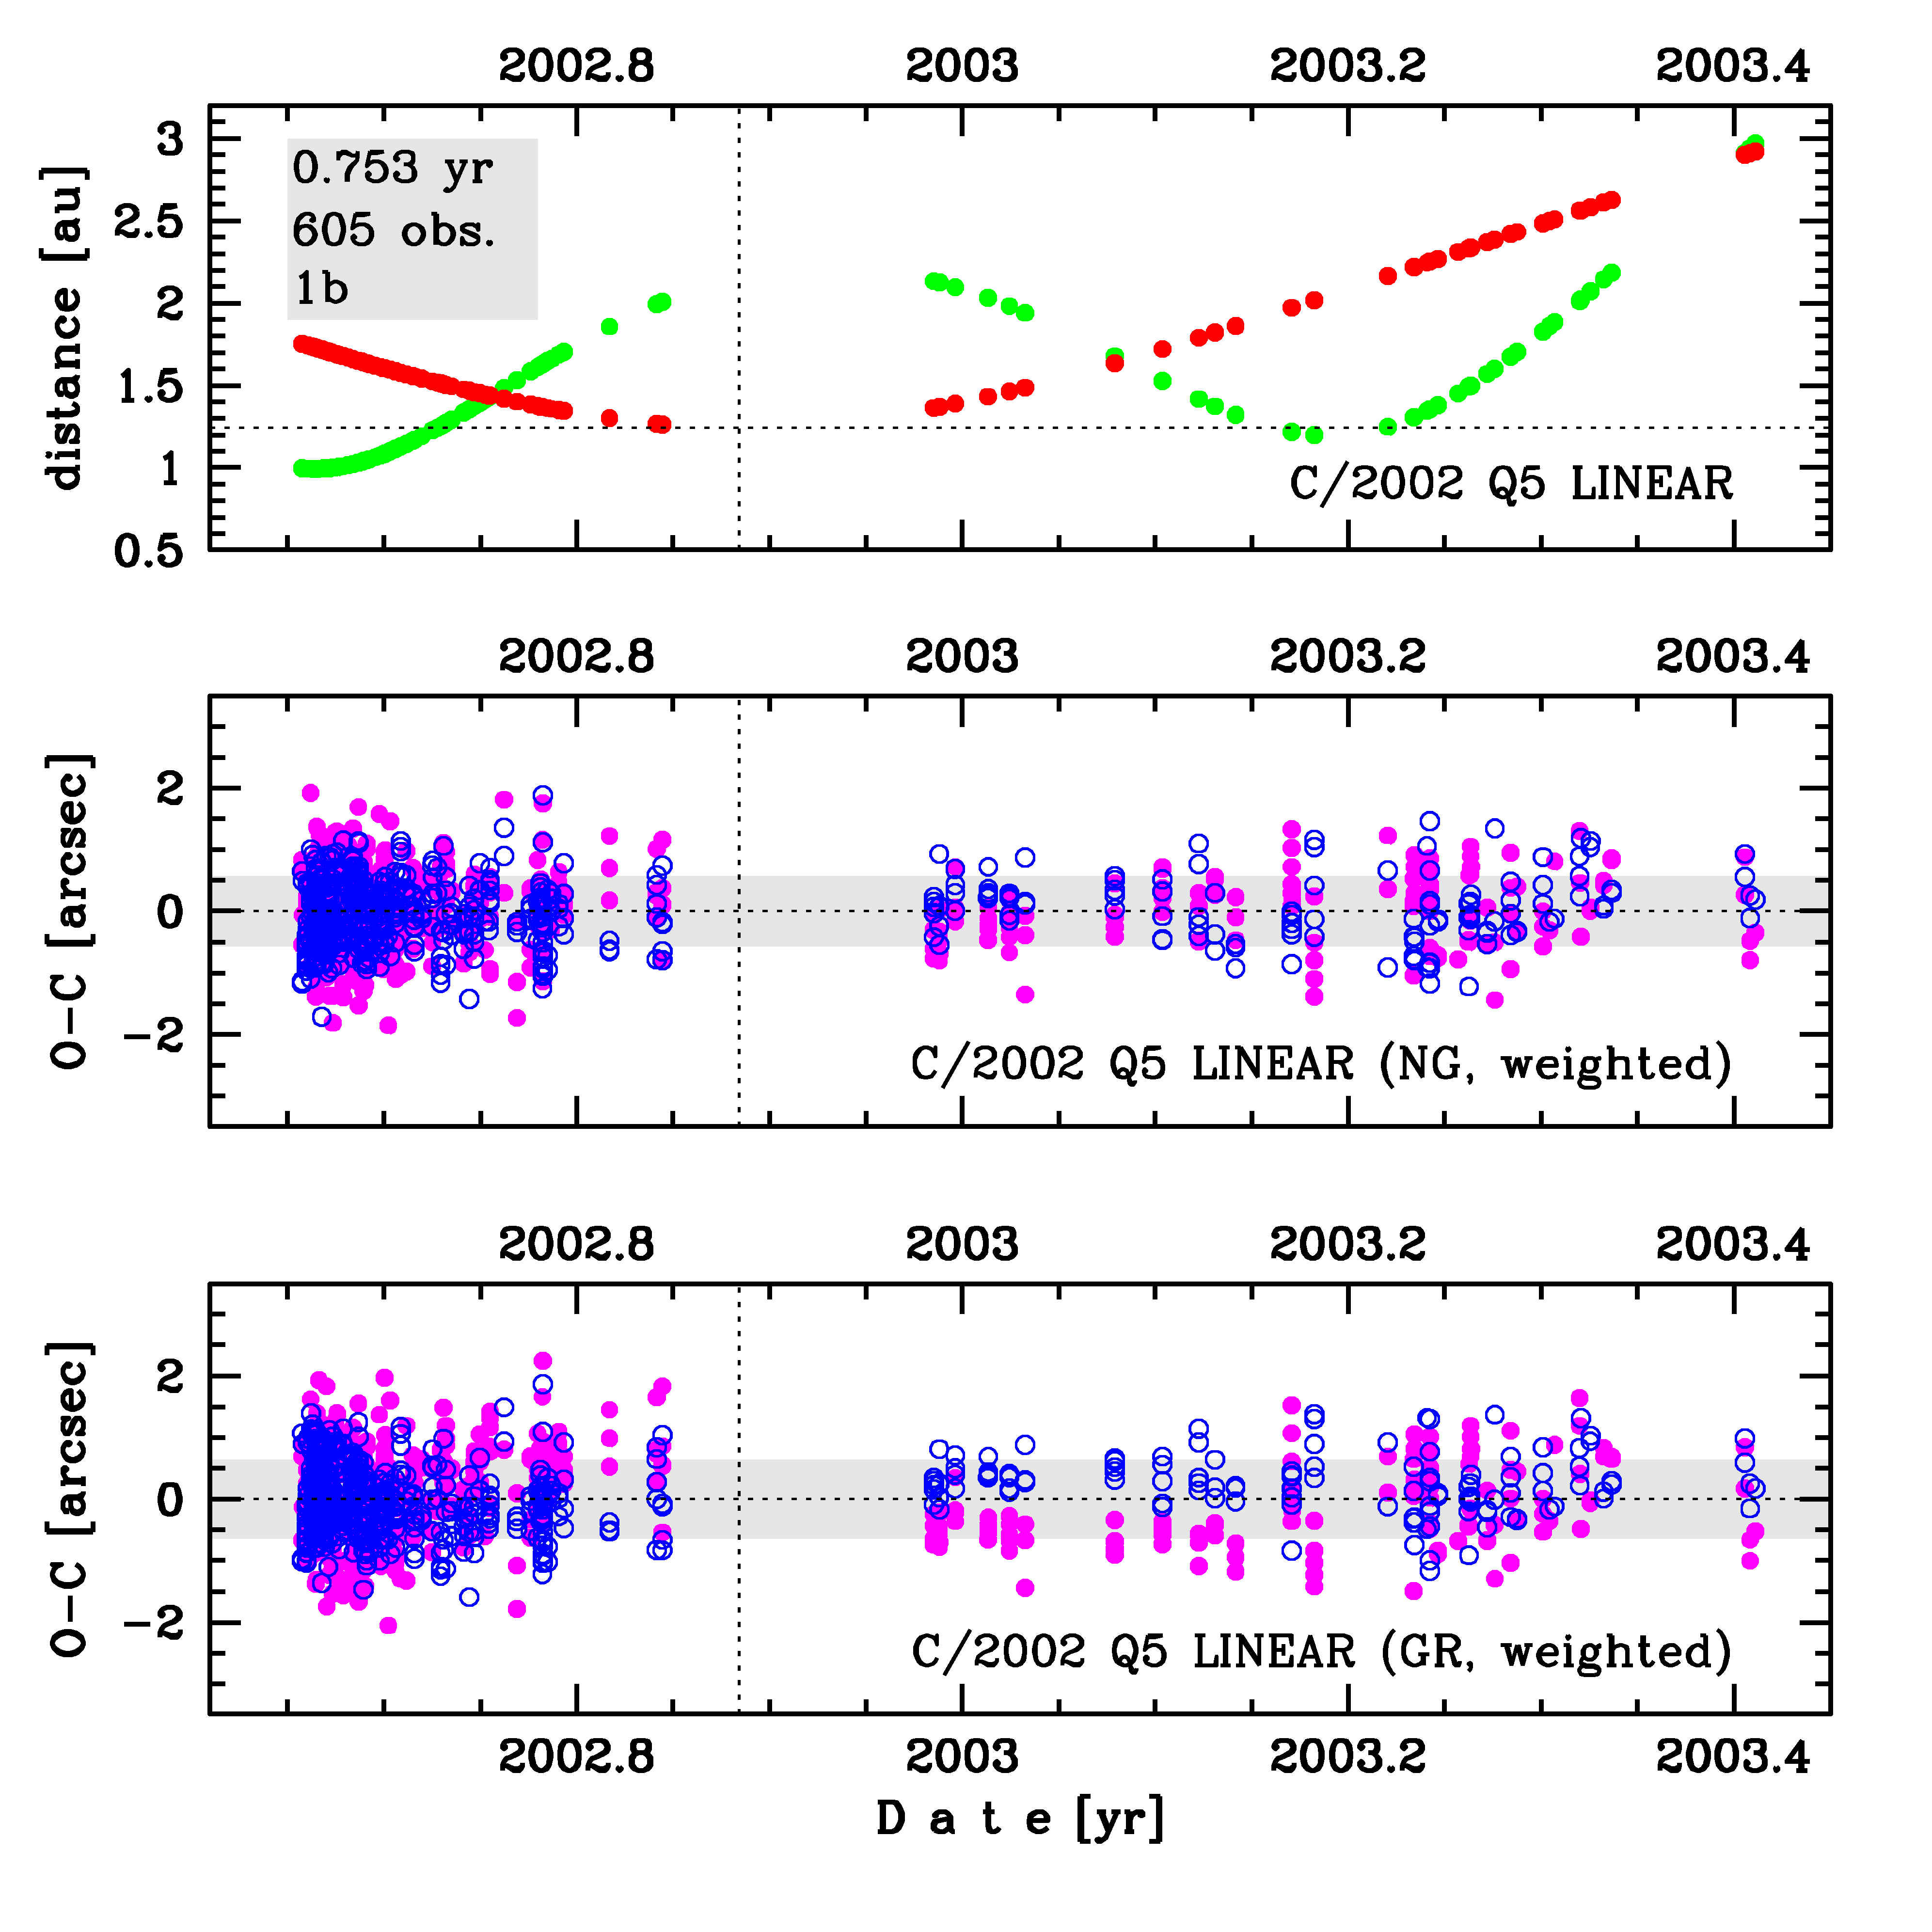
Upper panel: Time distribution of positional observations with corresponding heliocentric (red curve) and geocentric (green curve) distance at which they were taken. The horizontal dotted line shows the perihelion distance for a given comet whereas vertical dotted line — the moment of perihelion passage.
Lower panel (panels): O-C diagram for this(two) solution (solutions) given in this database, where residuals in right ascension are shown using magenta dots and in declination by blue open circles.
Lower panel (panels): O-C diagram for this(two) solution (solutions) given in this database, where residuals in right ascension are shown using magenta dots and in declination by blue open circles.
| previous_g orbit statistics, here only the Galactic tide has been included | ||
|---|---|---|
| no. of returning VCs in the swarm | 5001 | * |
| no. of escaping VCs in the swarm | 0 | |
| no. of hyperbolas among escaping VCs in the swarm | 0 | |
| previous reciprocal semi-major axis [10-6 au-1] | 39.42 – 47.32 – 54.89 | |
| previous perihelion distance [au] | 2.2 – 3.1 – 6.2 | |
| previous aphelion distance [103 au] | 36 – 42 – 51 | |
| time interval to previous perihelion [Myr] | 2.5 – 3.1 – 4 | |
| percentage of VCs with qprev < 10 | 97 | |
| percentage of VCs with 10 < qprev < 20 | 2 | |
| percentage of VCs with qprev > 20 | 1 | |