C/2002 T7 LINEAR
more info
Comet C/2002 T7 was discovered on 14 October 2002 with Lincoln Laboratory Near-Earth Asteroid Research project, that is about 1.5 yr before its perihelion passage. A few pre-discovery images were next found which were taken two days earlier during the same project. It was observed until 20 March 2006.
Comet had its closest approach to the Earth on 19 May 2004 (0.265 au), less than a month after its perihelion passage.
C/2002 T7 is a comet with non-gravitational effects strongly manifested in positional data fitting. The preferred solution given here is based on data taken only at large perihelion distances and spanning over 3.44 yr in a range of heliocentric distances from 6.91 au (pre-perihelion) to 8.08 au (post-perihelion), see picture.
A few other solutions based only of data taken before perihelion are also shown. Three are based on data until 4 December 2003 (p8, pn, pc) and one on shorter data-arc – until 17 April 2004 (p8). This last solution (p8) is about one year shorter than the previous solutions, and is limited to data taken well before the perihelion passage to the heliocentric distance of 2.5 au. This approach on the one hand allowed a reduction in the undesired effects associated with possible outburst events in this comet, and on the other hand allowed maintaining a very good quality orbit (quality reduction from class 1a+ to 1a) that can be used to the dynamical calculations back in time.
This Oort spike comet suffers moderate planetary perturbations during its passage through the planetary system; these perturbations lead to escape the comet from the planetary zone on a hyperbolic orbit (see future barycentric orbits). More details in Królikowska, Dybczyński and Sitarski and Królikowska 2020.
| solution description | ||
|---|---|---|
| number of observations | 2600 | |
| data interval | 2002 10 12 – 2006 03 20 | |
| data arc selection | only data taken in large heliocentric distance (DIS) | |
| range of heliocentric distances | 6.91 au – 0.62 au (perihelion) – 8.08 au | |
| type of model of motion | NS - non-gravitational orbits for standard g(r) | |
| data weighting | YES | |
| number of residuals | 5141 | |
| RMS [arcseconds] | 0.39 | |
| orbit quality class | 1a+ | |
| next orbit statistics, both Galactic and stellar perturbations were taken into account | ||
|---|---|---|
| no. of returning VCs in the swarm | 0 | |
| no. of escaping VCs in the swarm | 5001 | |
| no. of hyperbolas among escaping VCs in the swarm | 5001 | * |
| next reciprocal semi-major axis [10-6 au-1] | -660.88 – -658.64 – -656.38 | |
| next perihelion distance [au] | 2.681 – 2.689 – 2.698 | |
| synchronous stop epoch [Myr] | 0.743 | S |
| percentage of VCs with qnext < 10 | 100 | |
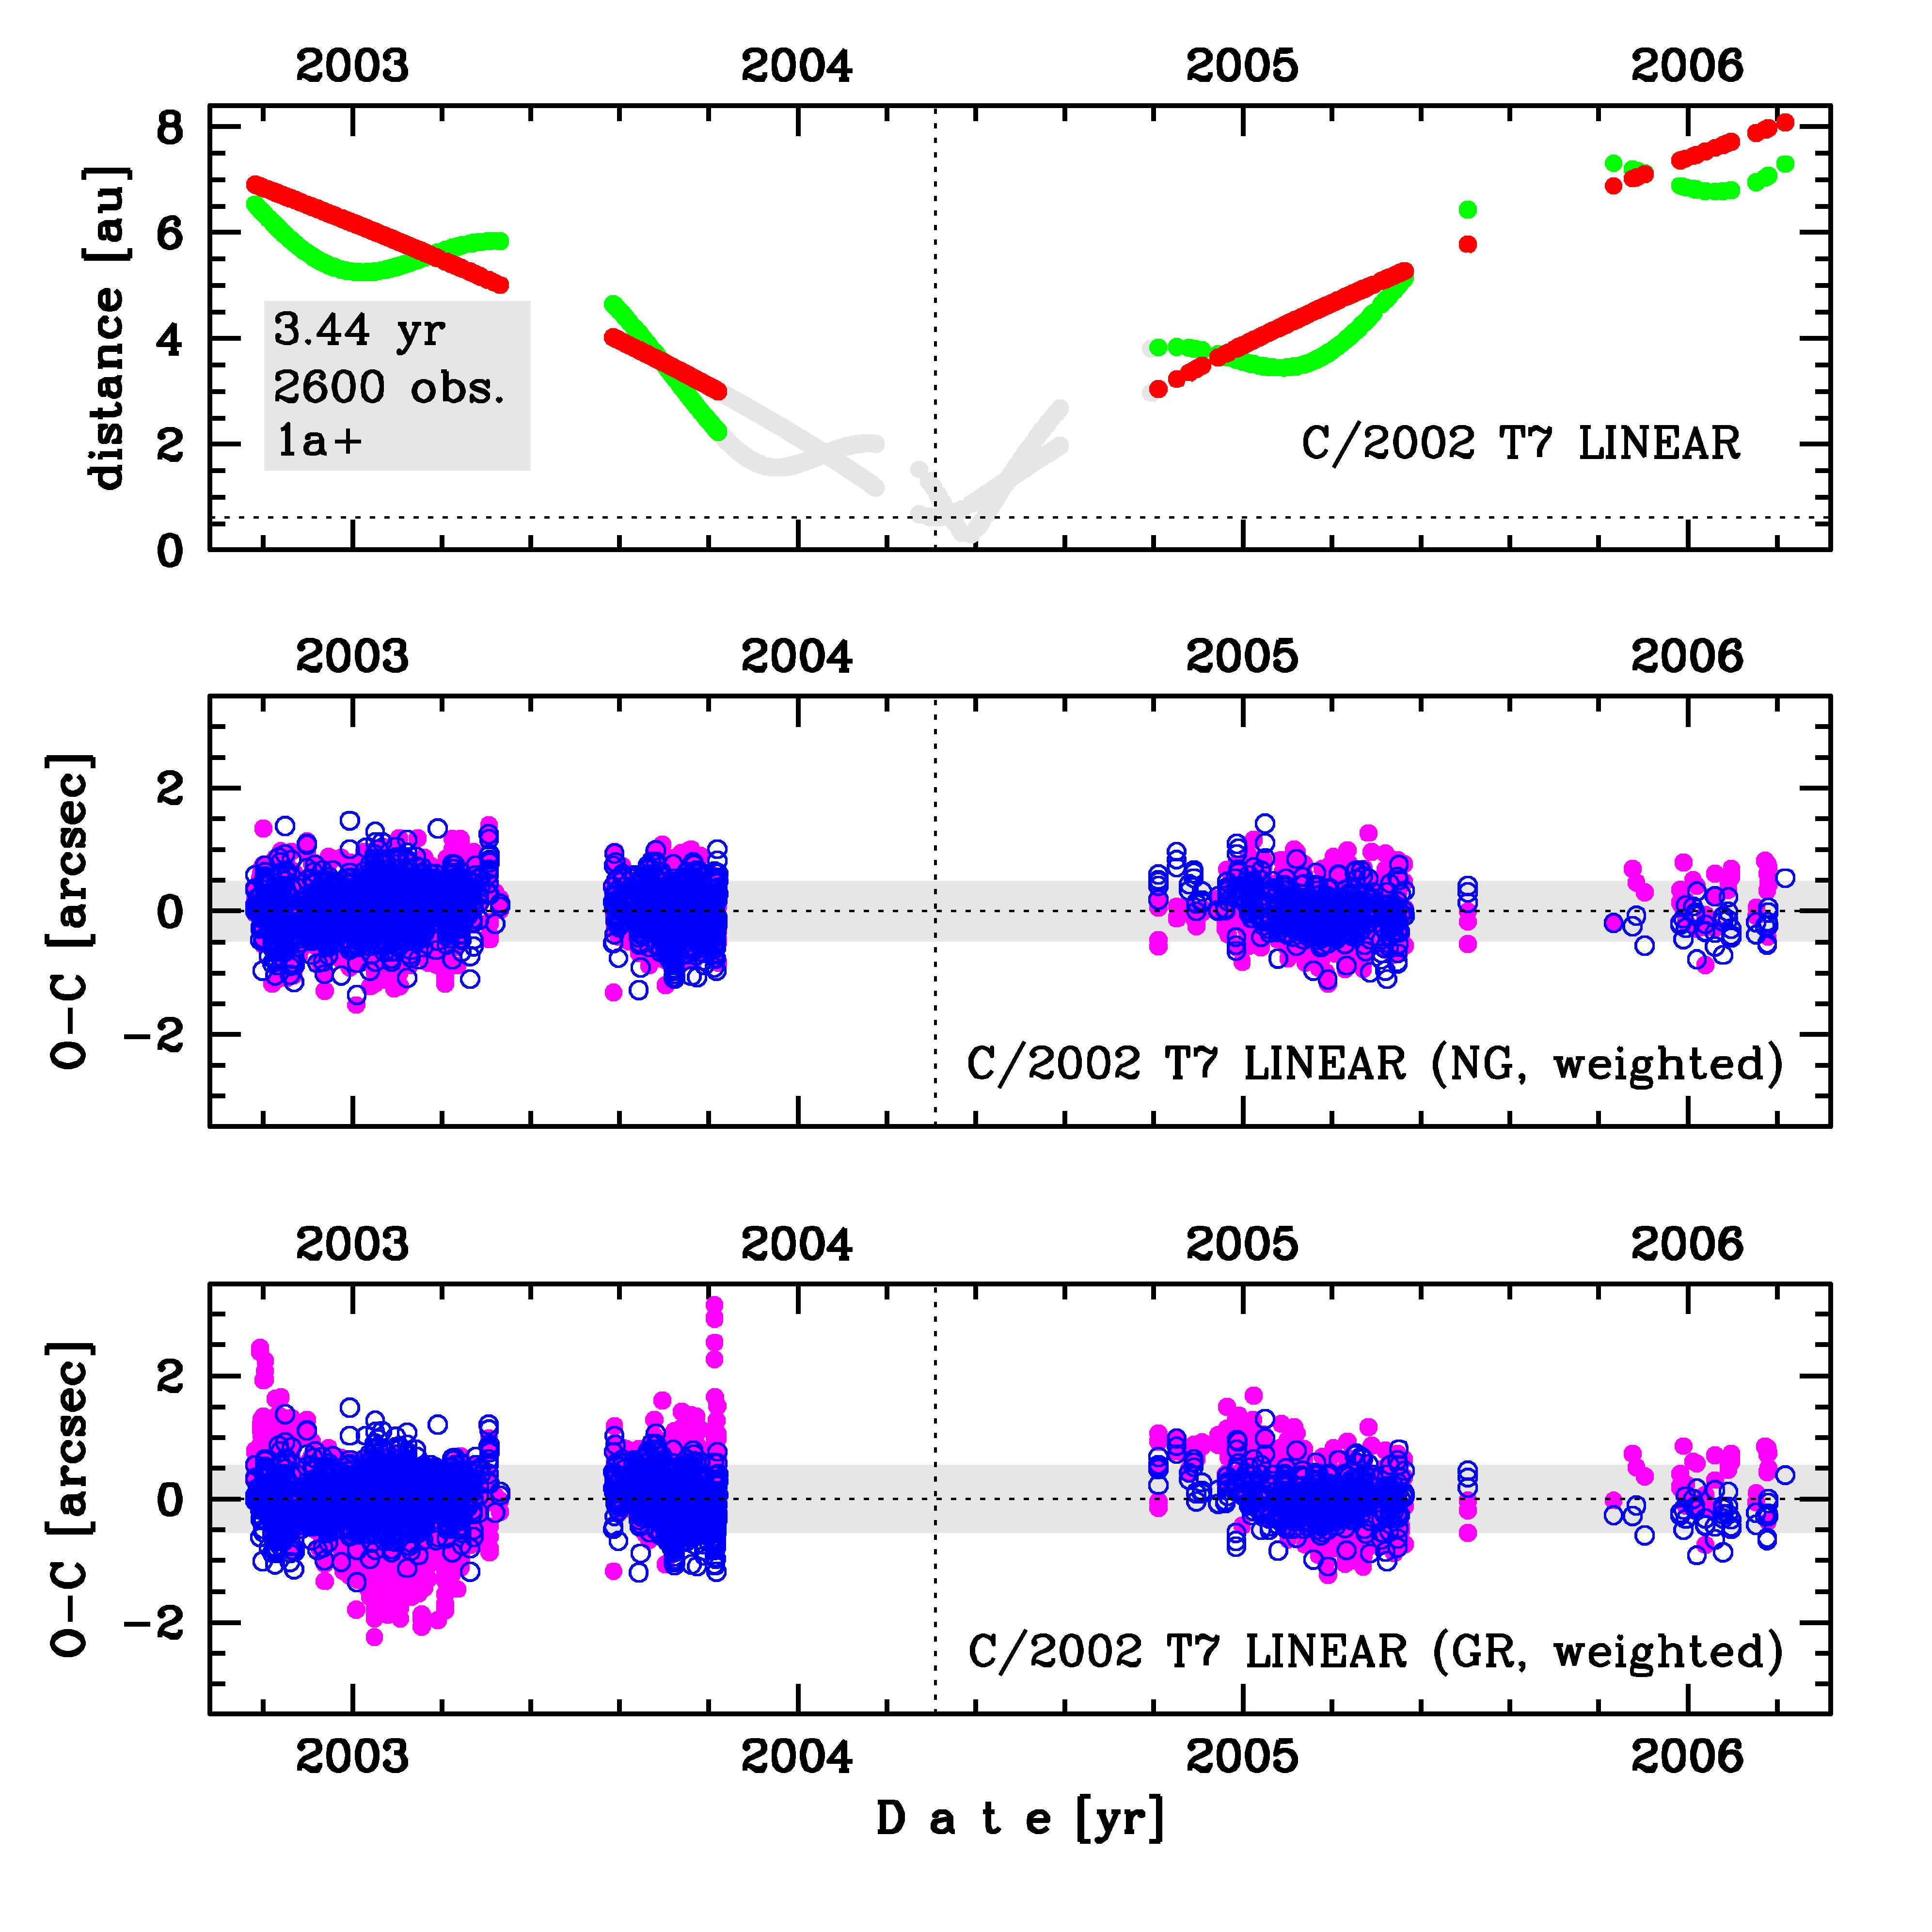
Upper panel: Time distribution of positional observations with corresponding heliocentric (red curve) and geocentric (green curve) distance at which they were taken. The horizontal dotted line shows the perihelion distance for a given comet whereas vertical dotted line — the moment of perihelion passage.
Lower panel (panels): O-C diagram for this(two) solution (solutions) given in this database, where residuals in right ascension are shown using magenta dots and in declination by blue open circles.
Lower panel (panels): O-C diagram for this(two) solution (solutions) given in this database, where residuals in right ascension are shown using magenta dots and in declination by blue open circles.
| next_g orbit statistics, here only the Galactic tide has been included | ||
|---|---|---|
| no. of returning VCs in the swarm | 0 | |
| no. of escaping VCs in the swarm | 5001 | |
| no. of hyperbolas among escaping VCs in the swarm | 5001 | * |
| next reciprocal semi-major axis [10-6 au-1] | -660.87 – -658.62 – -656.36 | |
| next perihelion distance [au] | 2.381 – 2.388 – 2.395 | |
| synchronous stop epoch [Myr] | 0.706 | S |
| percentage of VCs with qnext < 10 | 100 | |