C/2003 K4 LINEAR
more info
Comet C/2003 K4 was discovered on 28 May 2003 with Lincoln Laboratory Near-Earth Asteroid Research project, that is about 1.4 yr before its perihelion passage. It was observed until 17 November 2006.
Comet had its closest approach to the Earth on 23 December 2004 (1.153 au), about two months after its perihelion passage.
The preferred solution given here are based on data taken only at large perihelion distances and spanning over 3.47 yr in a range of heliocentric distances from 6.11 au (pre-perihelion) to 8.30 au (post-perihelion), see picture.
C/2003 K4 is a comet with non-gravitational effects strongly manifested in positional data fitting. The NG solution based on data obtained only at large distances from the Sun does not reveal substantial trends in residuals in the O-C diagram for this comet (lowest panel for preferred solution) while NG model based on entire data set shows some trends (middle panel for preferred solution). In particular, residuals in right ascension from the end of 2005 (and since last opposition in declination) are more randomly spread around zero compared with the NG model based on a full data arc.
This Oort spike comet suffers rather small planetary perturbations during its passage through the planetary system; however, these perturbations lead to escape the comet from the planetary zone on a hyperbolic orbit (see future barycentric orbits).
See also Królikowska 2014 and Królikowska 2020.
| solution description | ||
|---|---|---|
| number of observations | 1832 | |
| data interval | 2003 05 28 – 2006 11 17 | |
| data arc selection | only data taken in large heliocentric distance (DIS) | |
| range of heliocentric distances | 6.11 au – 1.02 au (perihelion) – 8.3 au | |
| type of model of motion | NS - non-gravitational orbits for standard g(r) | |
| data weighting | YES | |
| number of residuals | 3632 | |
| RMS [arcseconds] | 0.44 | |
| orbit quality class | 1a+ | |
| orbital elements (barycentric ecliptic J2000) | ||
|---|---|---|
| Epoch | 2300 12 30 | |
| perihelion date | 2004 10 13.16281021 | ± 0.00072801 |
| perihelion distance [au] | 1.02158994 | ± 0.00000199 |
| eccentricity | 1.00018592 | ± 0.00000261 |
| argument of perihelion [°] | 198.403591 | ± 0.000193 |
| ascending node [°] | 18.727300 | ± 0.000021 |
| inclination [°] | 134.215649 | ± 0.000022 |
| reciprocal semi-major axis [10-6 au-1] | -181.99 | ± 2.56 |
| file containing 5001 VCs swarm |
|---|
| 2003k4d6.bpl |
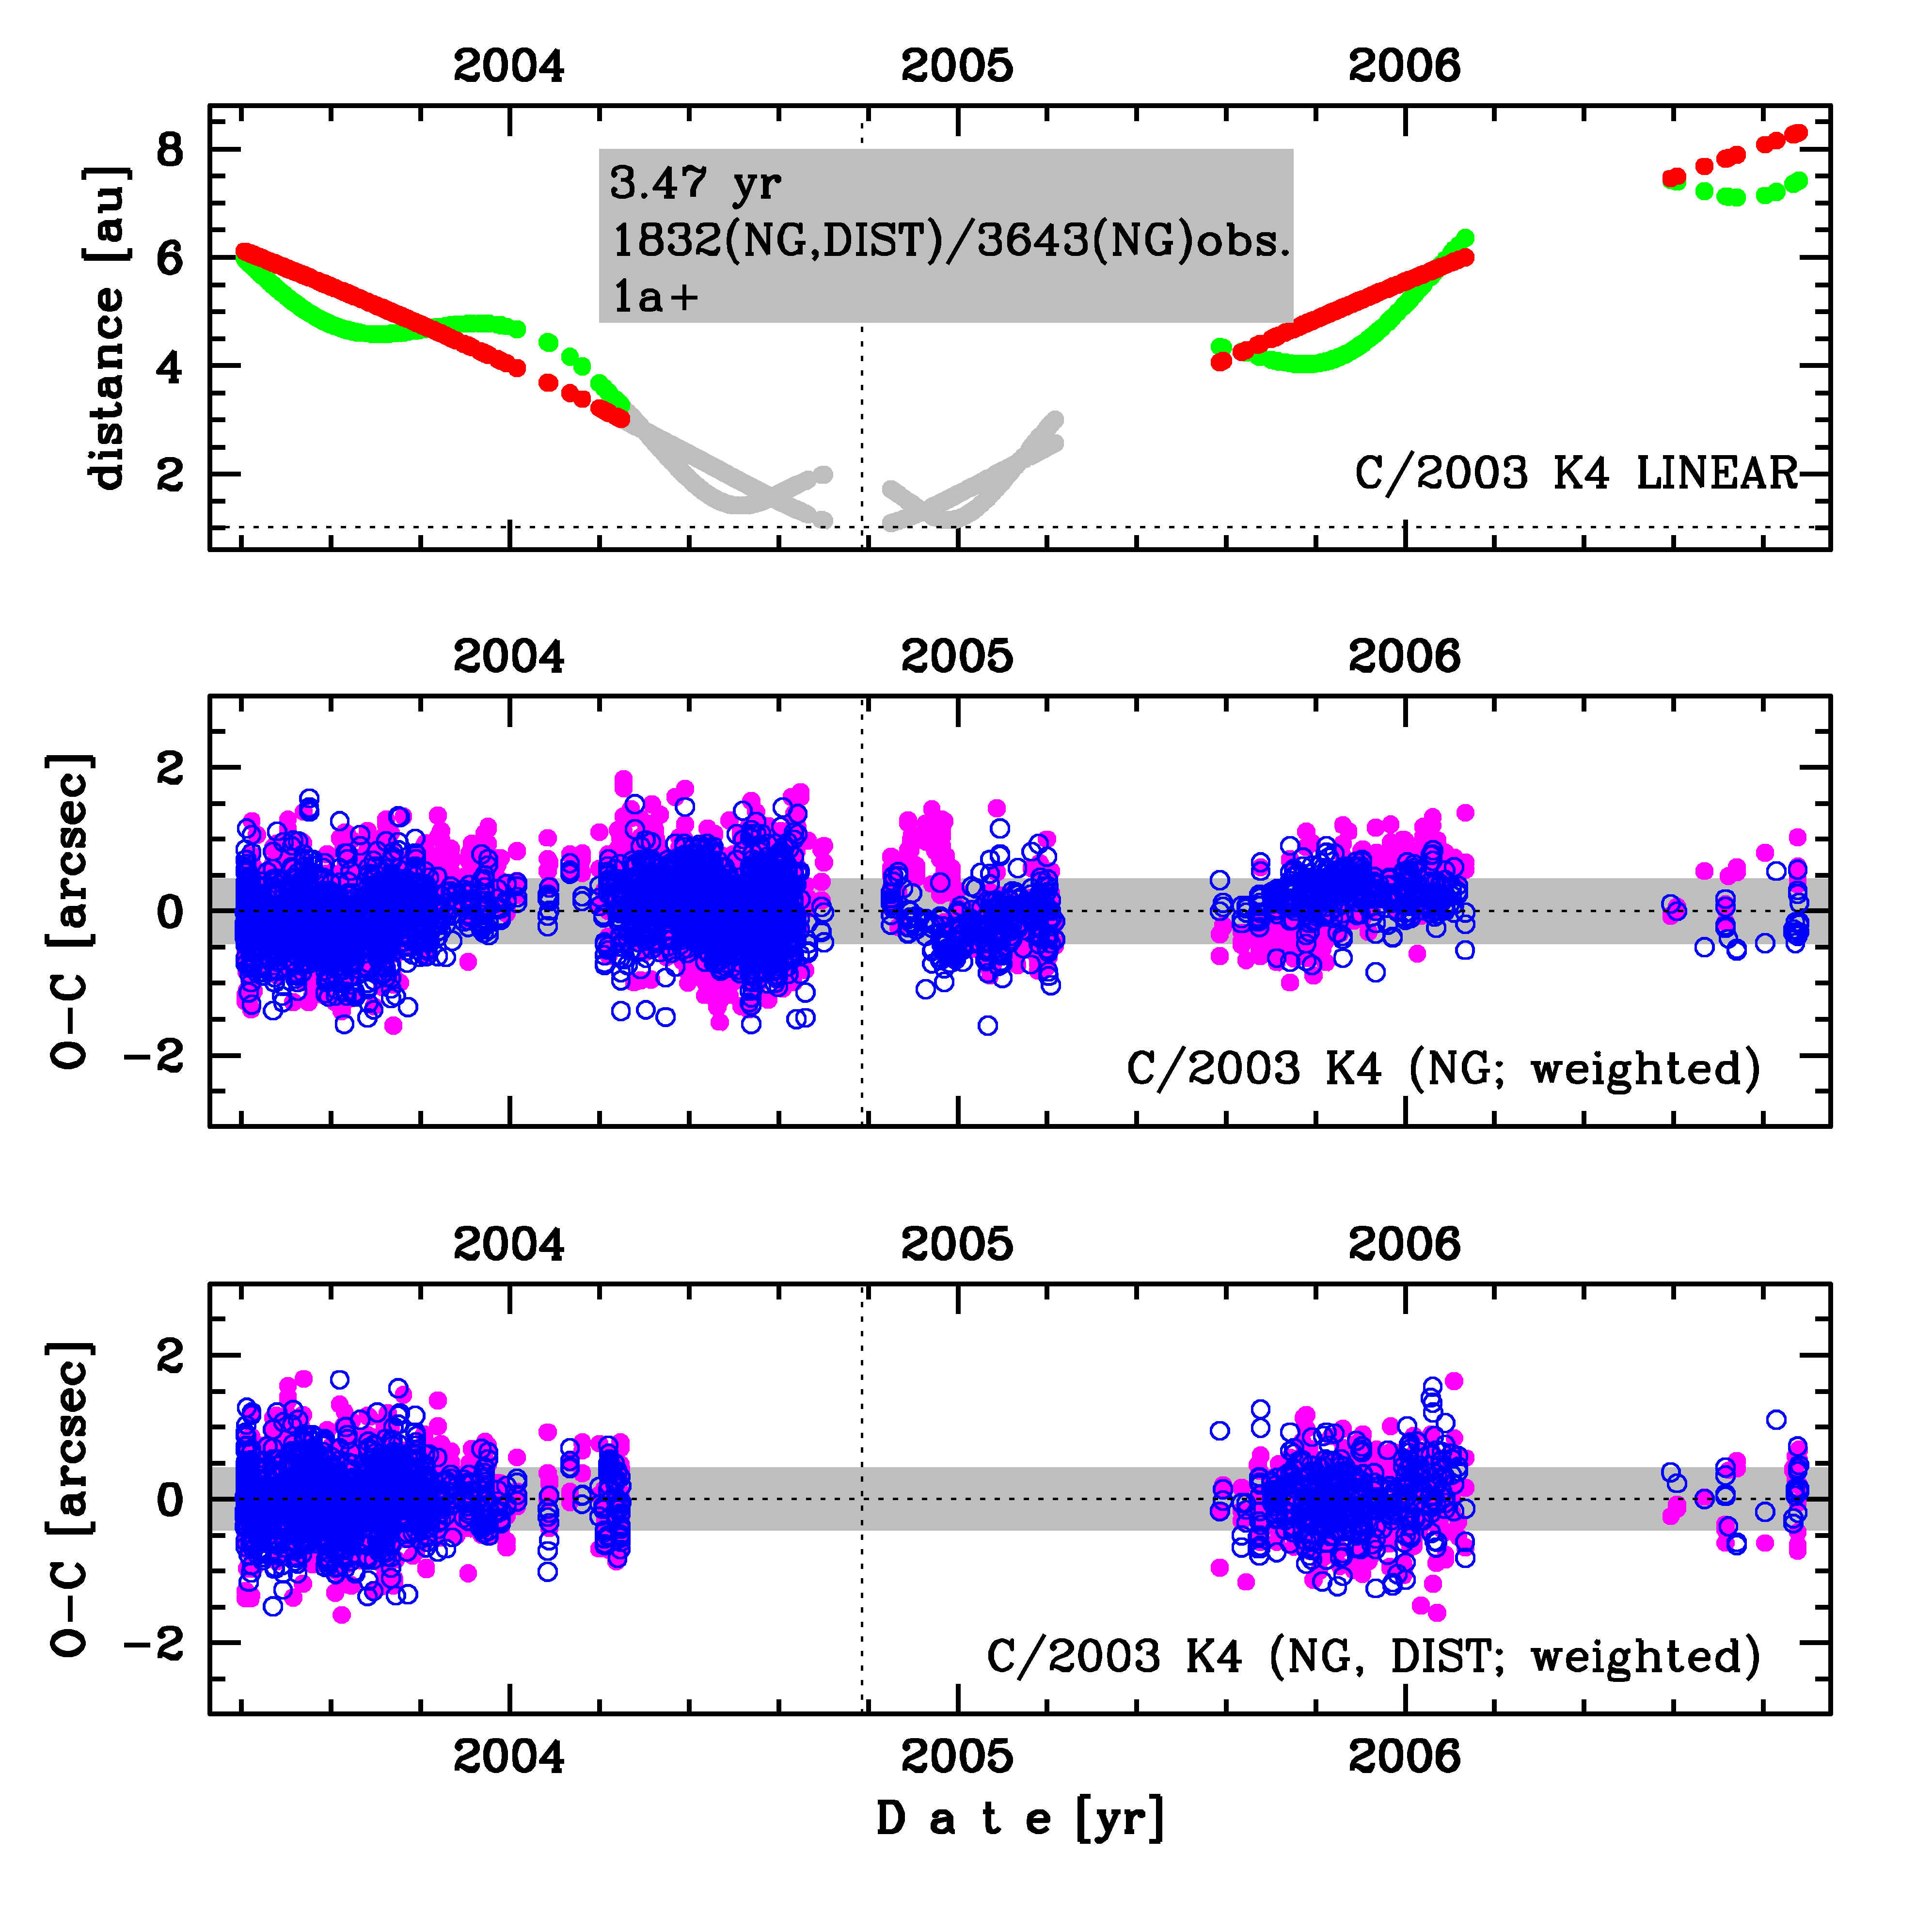
Upper panel: Time distribution of positional observations with corresponding heliocentric (red curve) and geocentric (green curve) distance at which they were taken. The horizontal dotted line shows the perihelion distance for a given comet whereas vertical dotted line — the moment of perihelion passage.
Lower panel (panels): O-C diagram for this(two) solution (solutions) given in this database, where residuals in right ascension are shown using magenta dots and in declination by blue open circles.
Lower panel (panels): O-C diagram for this(two) solution (solutions) given in this database, where residuals in right ascension are shown using magenta dots and in declination by blue open circles.
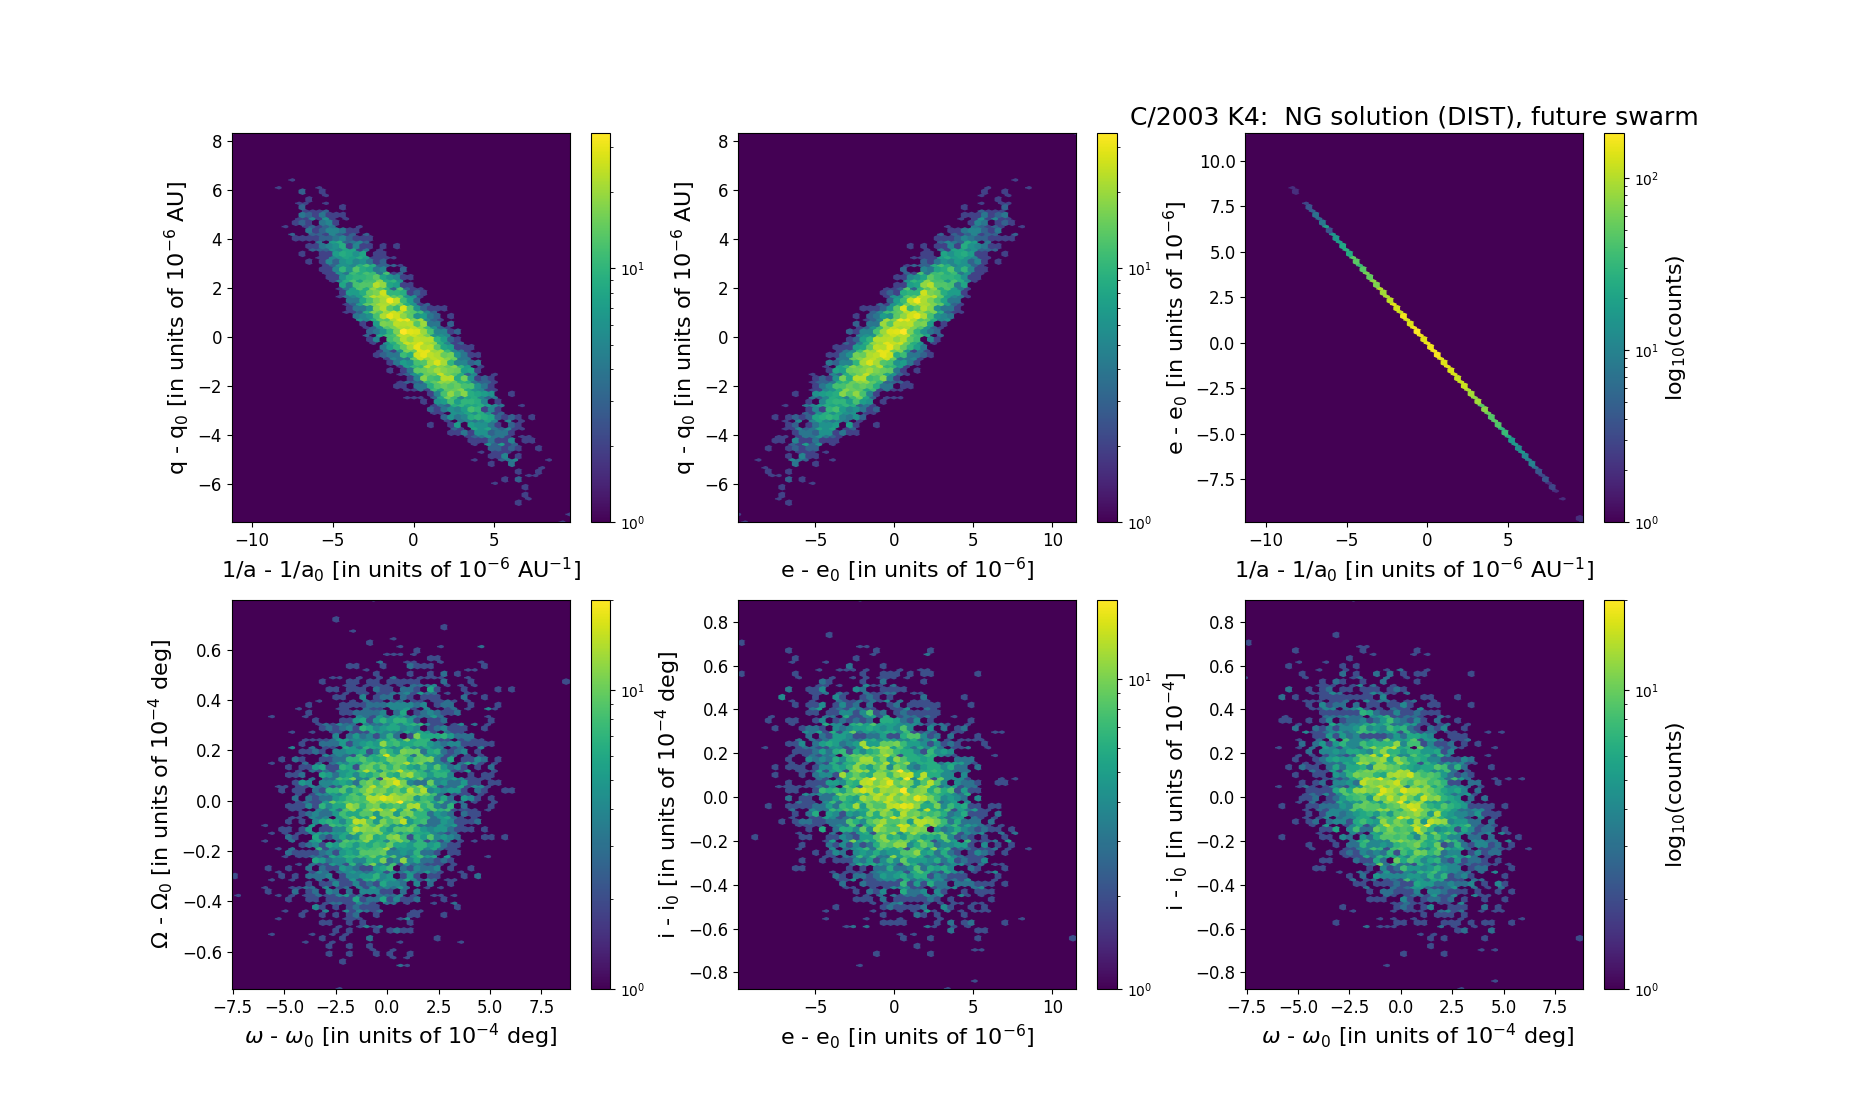
Six 2D-projections of the 6D space of future swarm including 5001 VCs. Each density map is given in logarithmic scale presented on the right in the individual panel.