C/2003 O1 LINEAR
more info
Comet C/2003 O1 was discovered on 19 July 2003 in the course of the LINEAR survey as an apparently asteroidal object (7.03 au from the Sun); however, soon its cometary activity were announced. Later, three prediscovery images were found from 27 July 2002 (7.88 au from the Sun). At the moment of discovery, it was 8 months before perihelion passage and a less than two weeks before its closest approach to the Earth.
Comet had its closest approach to the Earth on 30 July 2003 (6.447 au, 11 days after discovery, 7.5 months before perihelion); hovever at the second approach to the Earth in June 2004 (almost a year after perihelion passage) the comet was similarly close (6.455 au, see figure).
Solution given here is based on data spanning over 3.6 yr (5 oppositions) in a range of heliocentric distances: 7.88 au – 6.847 au (perihelion) – 7.19 au.
This comet suffers almost insignificant planetary perturbations during its passage through the planetary system.
See also Królikowska and Dybczyński 2017.
| solution description | ||
|---|---|---|
| number of observations | 576 | |
| data interval | 2002 07 27 – 2006 02 25 | |
| data type | perihelion within the observation arc (FULL) | |
| data arc selection | entire data set (STD) | |
| range of heliocentric distances | 7.88 au – 6.85 au (perihelion) – 7.19 au | |
| detectability of NG effects in the comet's motion | NG effects not determinable | |
| type of model of motion | GR - gravitational orbit | |
| data weighting | YES | |
| number of residuals | 1132 | |
| RMS [arcseconds] | 0.53 | |
| orbit quality class | 1a+ | |
| previous orbit statistics, both Galactic and stellar perturbations were taken into account | ||
|---|---|---|
| no. of returning VCs in the swarm | 5001 | * |
| no. of escaping VCs in the swarm | 0 | |
| no. of hyperbolas among escaping VCs in the swarm | 0 | |
| previous reciprocal semi-major axis [10-6 au-1] | 179.96 – 180.98 – 182.05 | |
| previous perihelion distance [au] | 6.8782 – 6.8789 – 6.8797 | |
| previous aphelion distance [103 au] | 10.98 – 11.04 – 11.11 | |
| time interval to previous perihelion [Myr] | 0.4066 – 0.4102 – 0.4136 | |
| percentage of VCs with qprev < 10 | 100 | |
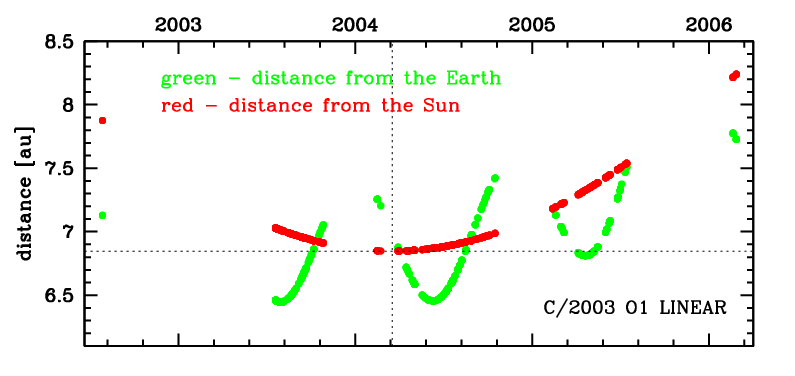
Time distribution of positional observations with corresponding heliocentric (red curve) and geocentric (green curve) distance at which they were taken. The horizontal dotted line shows the perihelion distance for a given comet whereas vertical dotted line — the moment of perihelion passage.
| previous_g orbit statistics, here only the Galactic tide has been included | ||
|---|---|---|
| no. of returning VCs in the swarm | 5001 | * |
| no. of escaping VCs in the swarm | 0 | |
| no. of hyperbolas among escaping VCs in the swarm | 0 | |
| previous reciprocal semi-major axis [10-6 au-1] | 179.96 – 180.98 – 182.04 | |
| previous perihelion distance [au] | 6.8802 – 6.881 – 6.8817 | |
| previous aphelion distance [103 au] | 10.98 – 11.04 – 11.11 | |
| time interval to previous perihelion [Myr] | 0.4066 – 0.4102 – 0.4137 | |
| percentage of VCs with qprev < 10 | 100 | |