C/2003 S3 LINEAR
more info
C/2003 S3 was discovered on 27 September 2003 during the LINEAR survey. Next day, its cometary apperance was confirmed [IAUC 8211, 2003 September 29]. At the moment of discovery, it was about 5.5 month after perihelion passage. Later, Syuichi Nakano linked observations of this comet with measurements of asteroid 2002 XM113 taken on 23 December 2001 (NEAT) and on 7, 11, and 23 December 2002 (LINEAR) [Nakano Notes 1022].
This comet made its closest approach to the Earth on 9 December 2002 (7.216 au), four months before perihelion. However, the second approach to the Earth was on 16 November 2003 (7.256 au, see figure), that is less than two months after the moment of discovery (see figure).
Solution given here is based on data spanning over 2.8 yr in a range of heliocentric distances: 8.61 au – 8.128 au (perihelion) – 8.80 au.
This Oort spike comet suffers slight planetary perturbations during its passage through the planetary system; however, these perturbations probably move out this comet from the solar system.
See also Królikowska 2014 and Królikowska and Dybczyński 2017.
| solution description | ||
|---|---|---|
| number of observations | 124 | |
| data interval | 2001 12 23 – 2004 10 23 | |
| data type | perihelion within the observation arc (FULL) | |
| data arc selection | entire data set (STD) | |
| range of heliocentric distances | 8.61 au – 8.13 au (perihelion) – 8.8 au | |
| detectability of NG effects in the comet's motion | NG effects not determinable | |
| type of model of motion | GR - gravitational orbit | |
| data weighting | YES | |
| number of residuals | 242 | |
| RMS [arcseconds] | 0.49 | |
| orbit quality class | 1a | |
| next orbit statistics, both Galactic and stellar perturbations were taken into account | ||
|---|---|---|
| no. of returning VCs in the swarm | 0 | |
| no. of escaping VCs in the swarm | 5001 | |
| no. of hyperbolas among escaping VCs in the swarm | 4789 | * |
| next reciprocal semi-major axis [10-6 au-1] | -8.93 – -5.01 – -1.32 | |
| next perihelion distance [au] | 144 – 149 – 155 | |
| next aphelion distance [103 au] | 830 – 2500 – 16000 | |
| synchronous stop epoch [Myr] | 2.51 | S |
| percentage of VCs with qnext > 20 | 100 | |
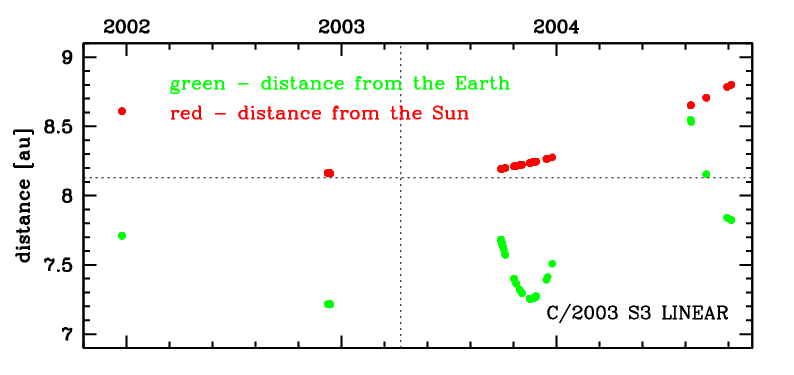
Time distribution of positional observations with corresponding heliocentric (red curve) and geocentric (green curve) distance at which they were taken. The horizontal dotted line shows the perihelion distance for a given comet whereas vertical dotted line — the moment of perihelion passage.
| next_g orbit statistics, here only the Galactic tide has been included | ||
|---|---|---|
| no. of returning VCs in the swarm | 0 | |
| no. of escaping VCs in the swarm | 5001 | |
| no. of hyperbolas among escaping VCs in the swarm | 4978 | * |
| next reciprocal semi-major axis [10-6 au-1] | -11.49 – -7.47 – -3.69 | |
| next perihelion distance [au] | 0.9 – 1.1 – 1.3 | |
| synchronous stop epoch [Myr] | 2.53 | S |
| percentage of VCs with qnext < 10 | 100 | |