C/2003 T3 Tabur
more info
Comet C/2003 T3 was discovered on 14 October 2003 by Vello Tabur (Australian Capital Territory); that is 6.5 months before its perihelion passage. It was observed until 3 May 2005.
Comet had its closest approach to the Earth on 22 May 2004 (2.319 au), about 3 weeks after its perihelion passage.
Preferred solution given here is based on data spanning over 1.55 yr in a range of heliocentric distances: 2.968 au – 1.481 au (perihelion) – 4.63 au, however NG solution based on pre-perihelion data (pn) is also adequate for past calculations.
This Oort spike comet suffers large planetary perturbations during its passage through the planetary system; these perturbations lead to a significantly more tight future orbit with semimajor axis of about 1,400 au.
See also Królikowska 2020.
| solution description | ||
|---|---|---|
| number of observations | 769 | |
| data interval | 2003 10 14 – 2005 05 03 | |
| data type | perihelion within the observation arc (FULL) | |
| data arc selection | entire data set (STD) | |
| range of heliocentric distances | 2.96 au – 1.48 au (perihelion) – 4.63 au | |
| type of model of motion | NS - non-gravitational orbits for standard g(r) | |
| data weighting | YES | |
| number of residuals | 1522 | |
| RMS [arcseconds] | 0.57 | |
| orbit quality class | 1a | |
| orbital elements (barycentric ecliptic J2000) | ||
|---|---|---|
| Epoch | 1705 05 03 | |
| perihelion date | 2004 04 29.09912043 | ± 0.00094733 |
| perihelion distance [au] | 1.48625944 | ± 0.00000266 |
| eccentricity | 1.00000271 | ± 0.00000720 |
| argument of perihelion [°] | 43.682940 | ± 0.000211 |
| ascending node [°] | 347.082691 | ± 0.000025 |
| inclination [°] | 50.412494 | ± 0.000031 |
| reciprocal semi-major axis [10-6 au-1] | -1.82 | ± 4.85 |
| file containing 5001 VCs swarm |
|---|
| 2003t3n4.bmi |
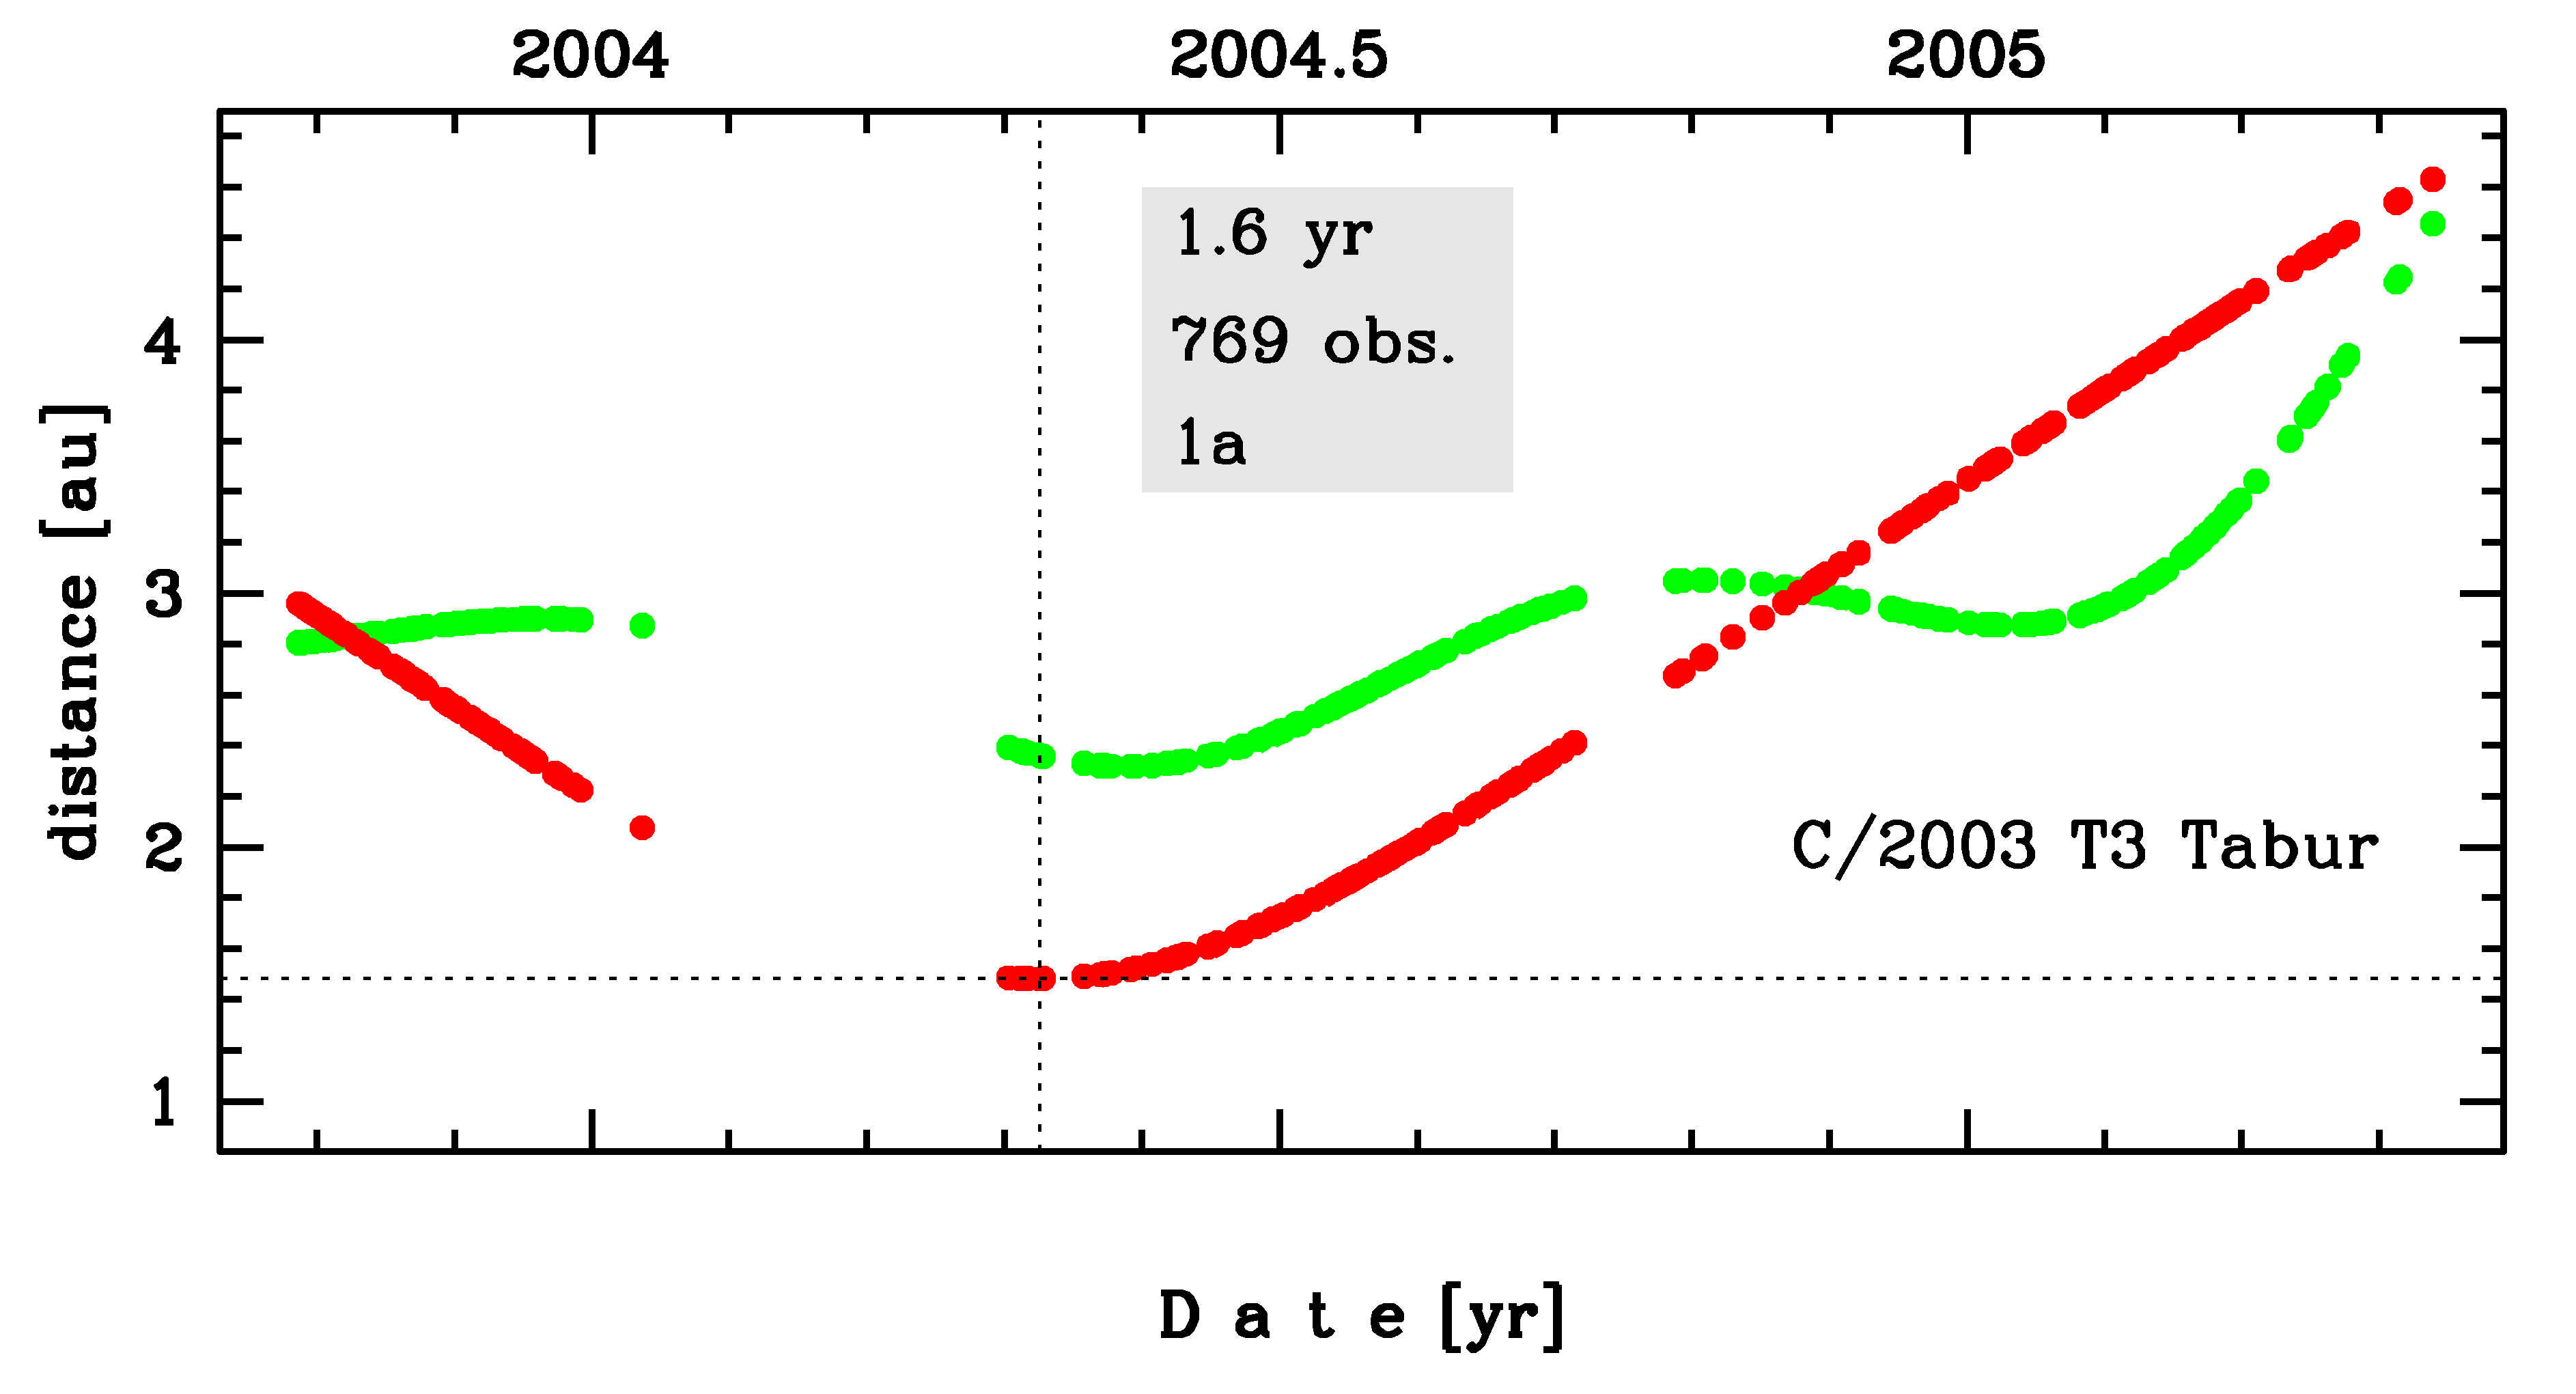
Time distribution of positional observations with corresponding heliocentric (red curve) and geocentric (green curve) distance at which they were taken. The horizontal dotted line shows the perihelion distance for a given comet whereas vertical dotted line — the moment of perihelion passage.
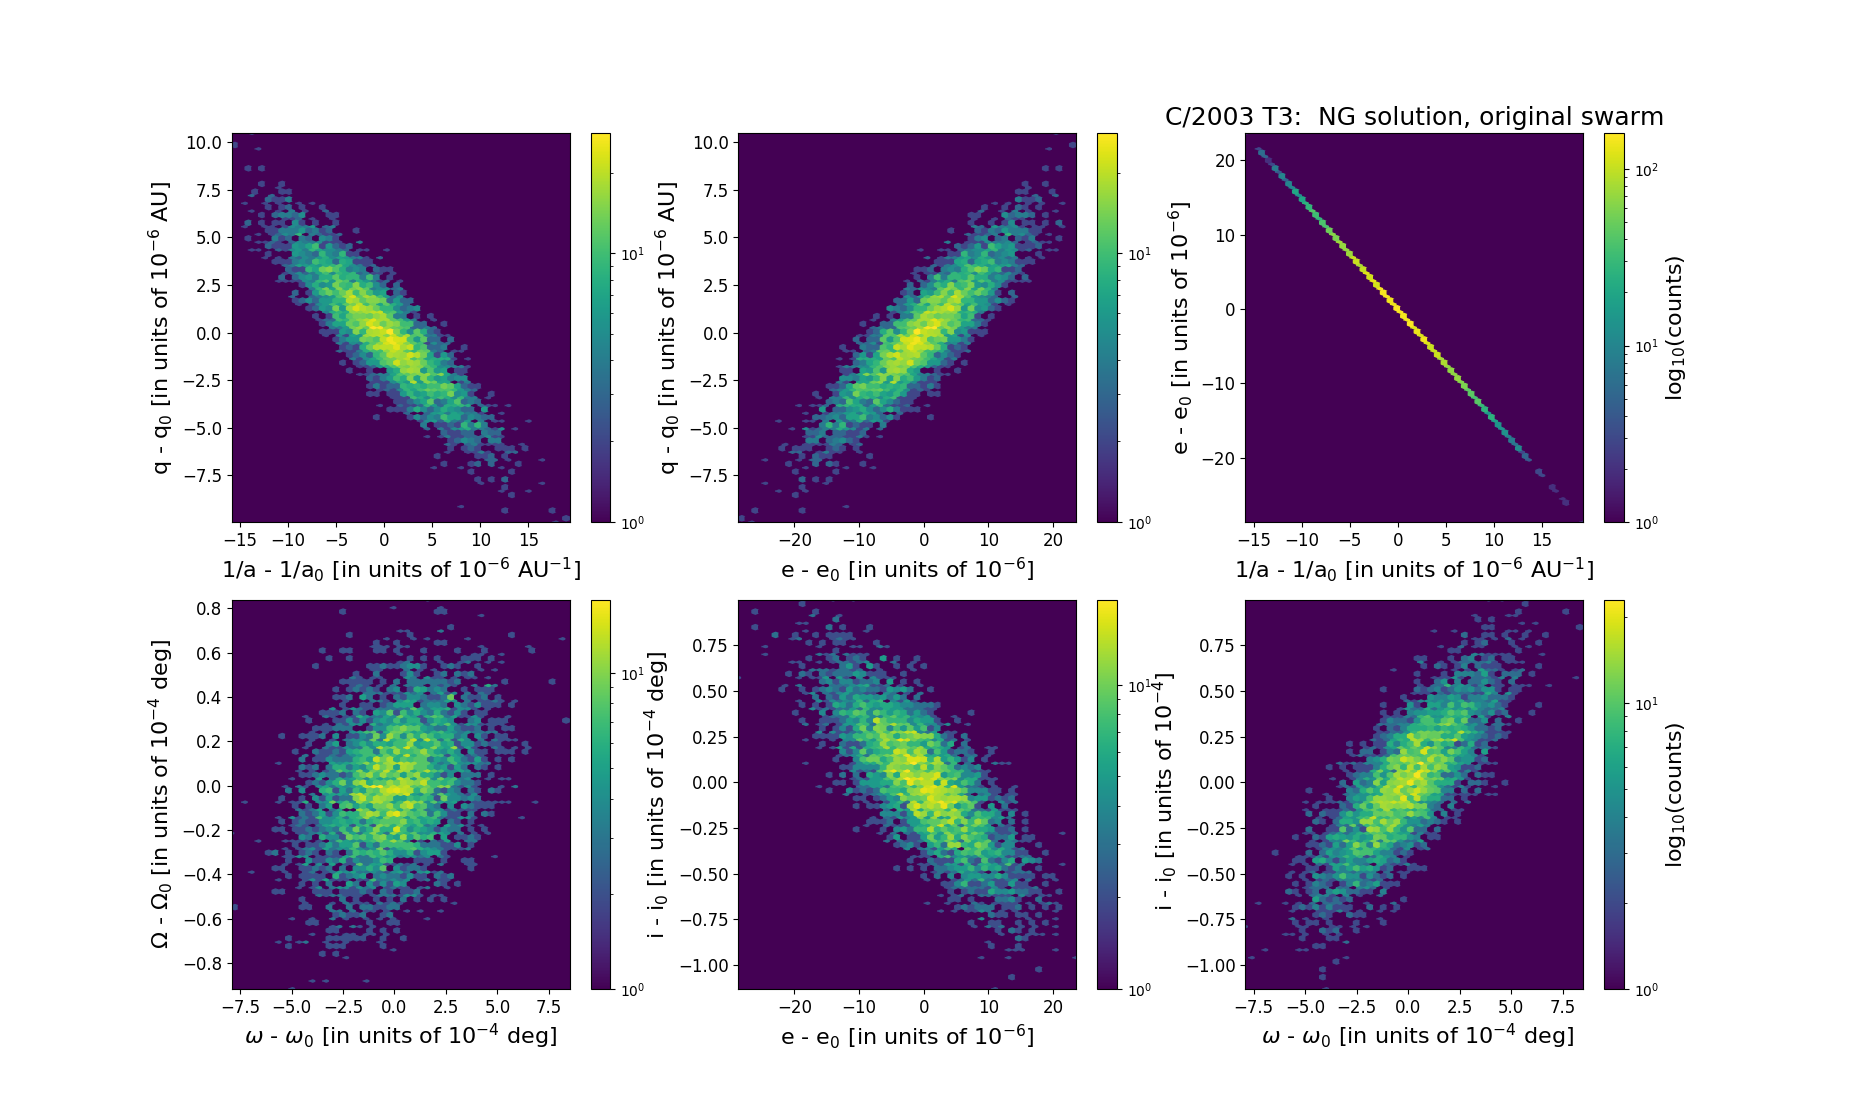
Six 2D-projections of the 6D space of original swarm including 5001 VCs. Each density map is given in logarithmic scale presented on the right in the individual panel.